SpareBank 1 SR-Bank (OB:SRBNK) shareholders have earned a 10% CAGR over the last five years


Stock pickers are generally looking for stocks that will outperform the broader market. And the truth is, you can make significant gains if you buy good quality businesses at the right price. For example, the SpareBank 1 SR-Bank ASA (OB:SRBNK) share price is up 28% in the last 5 years, clearly besting the market return of around 19% (ignoring dividends). However, more recent returns haven't been as impressive as that, with the stock returning just 7.0% in the last year, including dividends.
So let's assess the underlying fundamentals over the last 5 years and see if they've moved in lock-step with shareholder returns.
Check out our latest analysis for SpareBank 1 SR-Bank
To quote Buffett, 'Ships will sail around the world but the Flat Earth Society will flourish. There will continue to be wide discrepancies between price and value in the marketplace...' One way to examine how market sentiment has changed over time is to look at the interaction between a company's share price and its earnings per share (EPS).
During five years of share price growth, SpareBank 1 SR-Bank achieved compound earnings per share (EPS) growth of 8.7% per year. The EPS growth is more impressive than the yearly share price gain of 5% over the same period. So one could conclude that the broader market has become more cautious towards the stock. The reasonably low P/E ratio of 7.45 also suggests market apprehension.
The company's earnings per share (over time) is depicted in the image below (click to see the exact numbers).
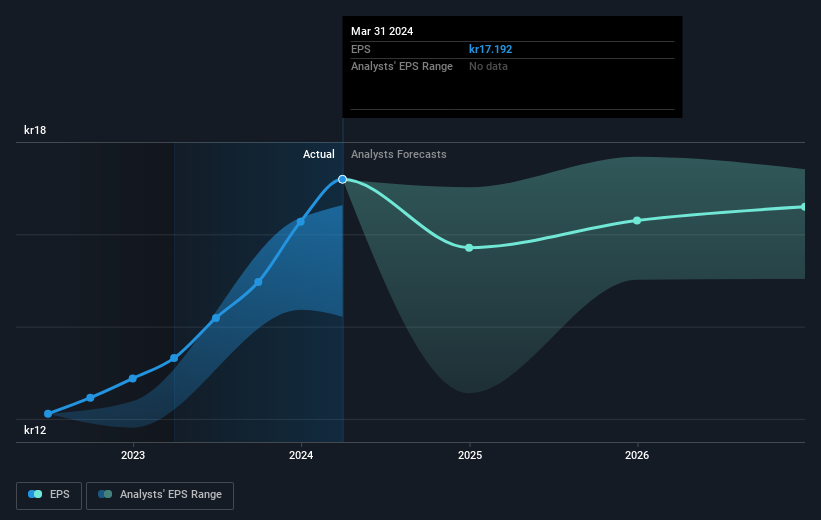
We know that SpareBank 1 SR-Bank has improved its bottom line over the last three years, but what does the future have in store? If you are thinking of buying or selling SpareBank 1 SR-Bank stock, you should check out this FREE detailed report on its balance sheet.
What About Dividends?
As well as measuring the share price return, investors should also consider the total shareholder return (TSR). The TSR incorporates the value of any spin-offs or discounted capital raisings, along with any dividends, based on the assumption that the dividends are reinvested. Arguably, the TSR gives a more comprehensive picture of the return generated by a stock. As it happens, SpareBank 1 SR-Bank's TSR for the last 5 years was 63%, which exceeds the share price return mentioned earlier. This is largely a result of its dividend payments!
A Different Perspective
SpareBank 1 SR-Bank provided a TSR of 7.0% over the last twelve months. But that return falls short of the market. If we look back over five years, the returns are even better, coming in at 10% per year for five years. It may well be that this is a business worth popping on the watching, given the continuing positive reception, over time, from the market. It's always interesting to track share price performance over the longer term. But to understand SpareBank 1 SR-Bank better, we need to consider many other factors. Case in point: We've spotted 2 warning signs for SpareBank 1 SR-Bank you should be aware of.
If you are like me, then you will not want to miss this free list of undervalued small caps that insiders are buying.
Please note, the market returns quoted in this article reflect the market weighted average returns of stocks that currently trade on Norwegian exchanges.
New: Manage All Your Stock Portfolios in One Place
We've created the ultimate portfolio companion for stock investors, and it's free.
• Connect an unlimited number of Portfolios and see your total in one currency
• Be alerted to new Warning Signs or Risks via email or mobile
• Track the Fair Value of your stocks
Have feedback on this article? Concerned about the content? Get in touch with us directly. Alternatively, email editorial-team (at) simplywallst.com.
This article by Simply Wall St is general in nature. We provide commentary based on historical data and analyst forecasts only using an unbiased methodology and our articles are not intended to be financial advice. It does not constitute a recommendation to buy or sell any stock, and does not take account of your objectives, or your financial situation. We aim to bring you long-term focused analysis driven by fundamental data. Note that our analysis may not factor in the latest price-sensitive company announcements or qualitative material. Simply Wall St has no position in any stocks mentioned.
Have feedback on this article? Concerned about the content? Get in touch with us directly. Alternatively, email editorial-team@simplywallst.com
About OB:SB1NO
SpareBank 1 Sør-Norge
SpareBank 1 SR-Bank ASA, together with its subsidiaries, provides various financial products and services for personal and corporate customers primarily in Rogaland, Agder, Vestland, Oslo, and Viken.
Undervalued with solid track record and pays a dividend.

