Stock Analysis

When we invest, we're generally looking for stocks that outperform the market average. And the truth is, you can make significant gains if you buy good quality businesses at the right price. For example, the SpareBank 1 Nord-Norge (OB:NONG) share price is up 48% in the last 5 years, clearly besting the market return of around 11% (ignoring dividends). On the other hand, the more recent gains haven't been so impressive, with shareholders gaining just 18% , including dividends .
While this past week has detracted from the company's five-year return, let's look at the recent trends of the underlying business and see if the gains have been in alignment.
Check out our latest analysis for SpareBank 1 Nord-Norge
To paraphrase Benjamin Graham: Over the short term the market is a voting machine, but over the long term it's a weighing machine. One way to examine how market sentiment has changed over time is to look at the interaction between a company's share price and its earnings per share (EPS).
During five years of share price growth, SpareBank 1 Nord-Norge achieved compound earnings per share (EPS) growth of 10.0% per year. The EPS growth is more impressive than the yearly share price gain of 8% over the same period. Therefore, it seems the market has become relatively pessimistic about the company. The reasonably low P/E ratio of 8.37 also suggests market apprehension.
You can see below how EPS has changed over time (discover the exact values by clicking on the image).
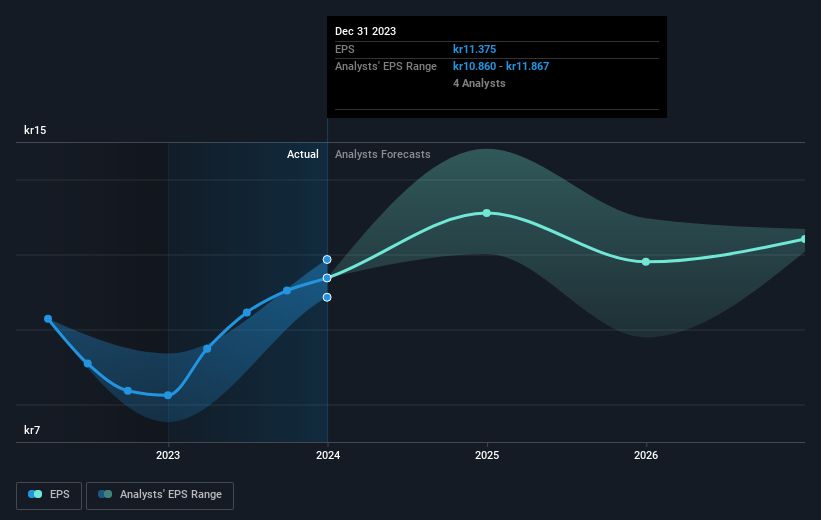
We're pleased to report that the CEO is remunerated more modestly than most CEOs at similarly capitalized companies. It's always worth keeping an eye on CEO pay, but a more important question is whether the company will grow earnings throughout the years. It might be well worthwhile taking a look at our free report on SpareBank 1 Nord-Norge's earnings, revenue and cash flow.
What About Dividends?
As well as measuring the share price return, investors should also consider the total shareholder return (TSR). The TSR is a return calculation that accounts for the value of cash dividends (assuming that any dividend received was reinvested) and the calculated value of any discounted capital raisings and spin-offs. So for companies that pay a generous dividend, the TSR is often a lot higher than the share price return. In the case of SpareBank 1 Nord-Norge, it has a TSR of 116% for the last 5 years. That exceeds its share price return that we previously mentioned. And there's no prize for guessing that the dividend payments largely explain the divergence!
A Different Perspective
It's nice to see that SpareBank 1 Nord-Norge shareholders have received a total shareholder return of 18% over the last year. Of course, that includes the dividend. Since the one-year TSR is better than the five-year TSR (the latter coming in at 17% per year), it would seem that the stock's performance has improved in recent times. Given the share price momentum remains strong, it might be worth taking a closer look at the stock, lest you miss an opportunity. Before forming an opinion on SpareBank 1 Nord-Norge you might want to consider the cold hard cash it pays as a dividend. This free chart tracks its dividend over time.
We will like SpareBank 1 Nord-Norge better if we see some big insider buys. While we wait, check out this free list of growing companies with considerable, recent, insider buying.
Please note, the market returns quoted in this article reflect the market weighted average returns of stocks that currently trade on Norwegian exchanges.
Valuation is complex, but we're helping make it simple.
Find out whether SpareBank 1 Nord-Norge is potentially over or undervalued by checking out our comprehensive analysis, which includes fair value estimates, risks and warnings, dividends, insider transactions and financial health.
View the Free AnalysisHave feedback on this article? Concerned about the content? Get in touch with us directly. Alternatively, email editorial-team (at) simplywallst.com.
This article by Simply Wall St is general in nature. We provide commentary based on historical data and analyst forecasts only using an unbiased methodology and our articles are not intended to be financial advice. It does not constitute a recommendation to buy or sell any stock, and does not take account of your objectives, or your financial situation. We aim to bring you long-term focused analysis driven by fundamental data. Note that our analysis may not factor in the latest price-sensitive company announcements or qualitative material. Simply Wall St has no position in any stocks mentioned.
About OB:NONG
SpareBank 1 Nord-Norge
SpareBank 1 Nord-Norge provides banking services in Northern Norway.
Undervalued with solid track record and pays a dividend.

