
Advertisement
Legendary fund manager Li Lu (who Charlie Munger backed) once said, 'The biggest investment risk is not the volatility of prices, but whether you will suffer a permanent loss of capital.' So it might be obvious that you need to consider debt, when you think about how risky any given stock is, because too much debt can sink a company. We can see that Aperam S.A. (AMS:APAM) does use debt in its business. But the real question is whether this debt is making the company risky.
When Is Debt Dangerous?
Generally speaking, debt only becomes a real problem when a company can't easily pay it off, either by raising capital or with its own cash flow. In the worst case scenario, a company can go bankrupt if it cannot pay its creditors. However, a more common (but still painful) scenario is that it has to raise new equity capital at a low price, thus permanently diluting shareholders. Of course, plenty of companies use debt to fund growth, without any negative consequences. When we think about a company's use of debt, we first look at cash and debt together.
See our latest analysis for Aperam
How Much Debt Does Aperam Carry?
As you can see below, Aperam had €931.0m of debt, at September 2023, which is about the same as the year before. You can click the chart for greater detail. However, it also had €285.0m in cash, and so its net debt is €646.0m.
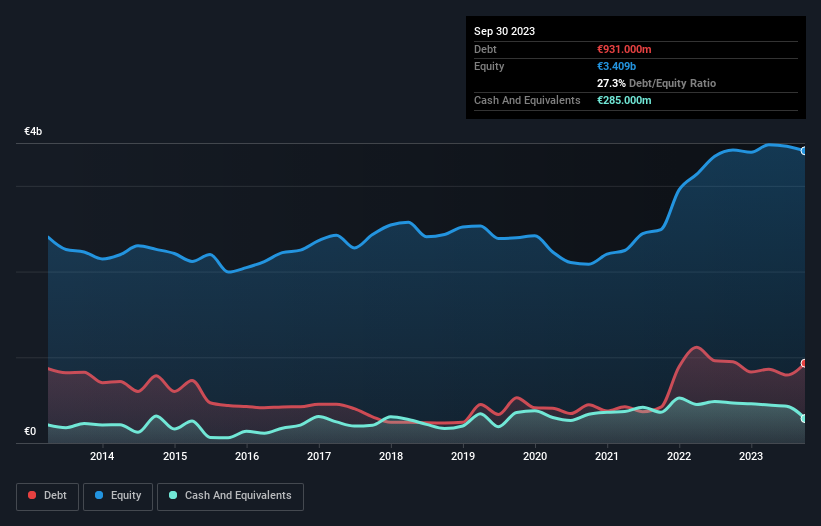
How Healthy Is Aperam's Balance Sheet?
The latest balance sheet data shows that Aperam had liabilities of €746.0m due within a year, and liabilities of €922.0m falling due after that. Offsetting these obligations, it had cash of €285.0m as well as receivables valued at €501.0m due within 12 months. So it has liabilities totalling €882.0m more than its cash and near-term receivables, combined.
While this might seem like a lot, it is not so bad since Aperam has a market capitalization of €2.15b, and so it could probably strengthen its balance sheet by raising capital if it needed to. However, it is still worthwhile taking a close look at its ability to pay off debt.
We use two main ratios to inform us about debt levels relative to earnings. The first is net debt divided by earnings before interest, tax, depreciation, and amortization (EBITDA), while the second is how many times its earnings before interest and tax (EBIT) covers its interest expense (or its interest cover, for short). The advantage of this approach is that we take into account both the absolute quantum of debt (with net debt to EBITDA) and the actual interest expenses associated with that debt (with its interest cover ratio).
Aperam's net debt to EBITDA ratio of about 2.4 suggests only moderate use of debt. And its strong interest cover of 1k times, makes us even more comfortable. Shareholders should be aware that Aperam's EBIT was down 90% last year. If that earnings trend continues then paying off its debt will be about as easy as herding cats on to a roller coaster. The balance sheet is clearly the area to focus on when you are analysing debt. But it is future earnings, more than anything, that will determine Aperam's ability to maintain a healthy balance sheet going forward. So if you want to see what the professionals think, you might find this free report on analyst profit forecasts to be interesting.
Finally, a business needs free cash flow to pay off debt; accounting profits just don't cut it. So we always check how much of that EBIT is translated into free cash flow. Looking at the most recent three years, Aperam recorded free cash flow of 39% of its EBIT, which is weaker than we'd expect. That weak cash conversion makes it more difficult to handle indebtedness.
Our View
Aperam's EBIT growth rate and net debt to EBITDA definitely weigh on it, in our esteem. But its interest cover tells a very different story, and suggests some resilience. Taking the abovementioned factors together we do think Aperam's debt poses some risks to the business. So while that leverage does boost returns on equity, we wouldn't really want to see it increase from here. The balance sheet is clearly the area to focus on when you are analysing debt. But ultimately, every company can contain risks that exist outside of the balance sheet. Case in point: We've spotted 3 warning signs for Aperam you should be aware of, and 1 of them is potentially serious.
At the end of the day, it's often better to focus on companies that are free from net debt. You can access our special list of such companies (all with a track record of profit growth). It's free.
New: Manage All Your Stock Portfolios in One Place
We've created the ultimate portfolio companion for stock investors, and it's free.
• Connect an unlimited number of Portfolios and see your total in one currency
• Be alerted to new Warning Signs or Risks via email or mobile
• Track the Fair Value of your stocks
Have feedback on this article? Concerned about the content? Get in touch with us directly. Alternatively, email editorial-team (at) simplywallst.com.
This article by Simply Wall St is general in nature. We provide commentary based on historical data and analyst forecasts only using an unbiased methodology and our articles are not intended to be financial advice. It does not constitute a recommendation to buy or sell any stock, and does not take account of your objectives, or your financial situation. We aim to bring you long-term focused analysis driven by fundamental data. Note that our analysis may not factor in the latest price-sensitive company announcements or qualitative material. Simply Wall St has no position in any stocks mentioned.
About ENXTAM:APAM
Established dividend payer with adequate balance sheet.
Similar Companies
Market Insights

Advertisement
Community Narratives
MINISO's fair value is projected at 26.69 with an anticipated PE ratio shift of 20x
Fair Value US$24.03|11.0% undervalued
BE
Community Contributor
Procter & Gamble: A Dividend Giant Facing Slowing Growth
Fair Value US$119.81|23.3% overvalued
AN
Community Contributor
Eli Lilly's Future Growth Driven by Tirzepatide and Favorable Market Conditions
Fair Value US$1.19k|13.8% undervalued
EA
Community Contributor