Advertisement
- France
- /
- Auto Components
- /
- ENXTPA:BUR
European Dividend Stocks To Consider Now

Simply Wall St
Reviewed by Simply Wall St
As European markets experience a positive upswing, with major indices like the STOXX Europe 600 Index and Germany's DAX showing notable gains, investors are increasingly looking towards stable investment options such as dividend stocks. In this climate of improving business activity and consumer confidence, selecting dividend stocks with strong fundamentals can provide a reliable income stream while potentially benefiting from capital appreciation.
Top 10 Dividend Stocks In Europe
| Name | Dividend Yield | Dividend Rating |
| Zurich Insurance Group (SWX:ZURN) | 4.29% | ★★★★★★ |
| Scandinavian Tobacco Group (CPSE:STG) | 9.76% | ★★★★★★ |
| Les Docks des Pétroles d'Ambès -SA (ENXTPA:DPAM) | 5.54% | ★★★★★★ |
| Holcim (SWX:HOLN) | 4.35% | ★★★★★★ |
| HEXPOL (OM:HPOL B) | 4.94% | ★★★★★★ |
| freenet (XTRA:FNTN) | 6.77% | ★★★★★☆ |
| Evolution (OM:EVO) | 4.66% | ★★★★★★ |
| DKSH Holding (SWX:DKSH) | 4.12% | ★★★★★★ |
| Cembra Money Bank (SWX:CMBN) | 4.66% | ★★★★★★ |
| Bravida Holding (OM:BRAV) | 4.55% | ★★★★★★ |
Click here to see the full list of 224 stocks from our Top European Dividend Stocks screener.
Below we spotlight a couple of our favorites from our exclusive screener.
Koninklijke BAM Groep (ENXTAM:BAMNB)
Simply Wall St Dividend Rating: ★★★★☆☆
Overview: Koninklijke BAM Groep nv operates globally in construction and property, civil engineering, and public-private partnerships, with a market cap of €2.16 billion.
Operations: Koninklijke BAM Groep generates its revenue primarily from three segments: €3.38 billion from Division Netherlands, €3.20 billion from Division United Kingdom and Ireland, and €110.16 million from Germany, Belgium, and International operations.
Dividend Yield: 3%
Koninklijke BAM Groep's dividend payments are well covered by cash flows, with a cash payout ratio of 33.4%, indicating sustainability despite a volatile dividend history over the past decade. The stock trades at 64.3% below its fair value estimate, suggesting potential undervaluation. However, its dividend yield of 3.05% is lower than the top Dutch market payers and recent profit margins have declined to 1.6%. A completed share buyback may support future value creation efforts.
- Click to explore a detailed breakdown of our findings in Koninklijke BAM Groep's dividend report.
- Upon reviewing our latest valuation report, Koninklijke BAM Groep's share price might be too optimistic.

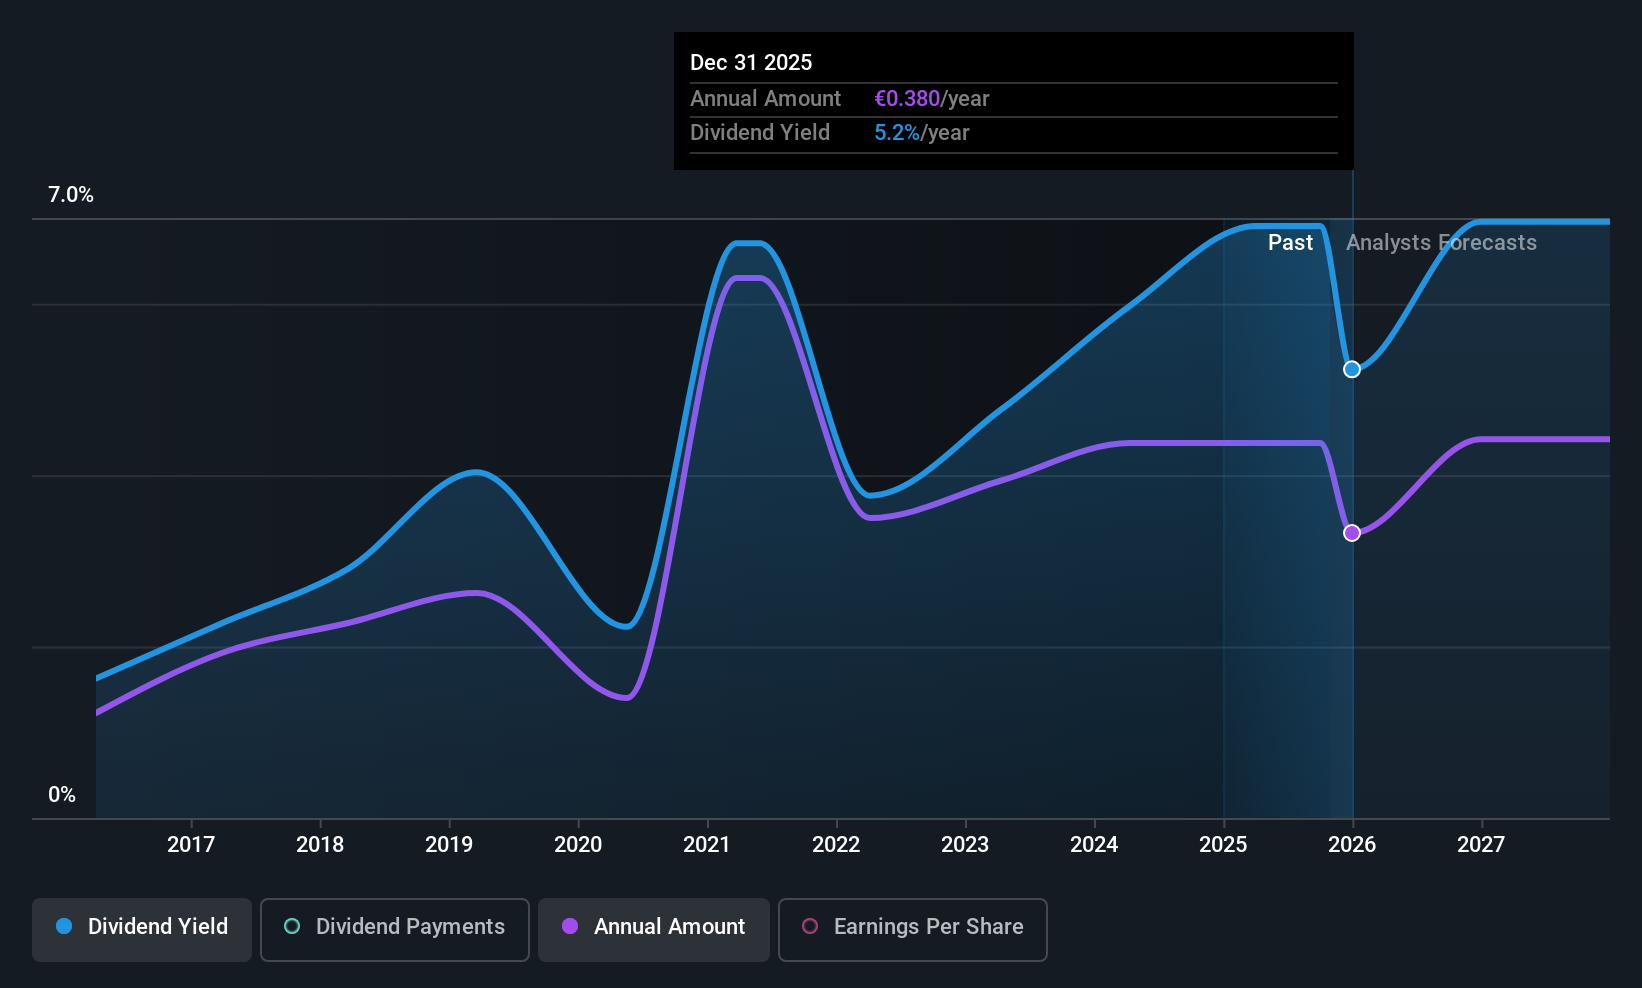
Burelle (ENXTPA:BUR)
Simply Wall St Dividend Rating: ★★★★☆☆
Overview: Burelle SA, with a market cap of €718.68 million, operates through its subsidiaries to provide automotive equipment both in France and internationally.
Operations: Burelle SA generates its revenue primarily from automotive equipment, amounting to €10.40 billion, with an additional contribution of €31 million from real estate activities.
Dividend Yield: 3.9%
Burelle's dividend payments, while covered by earnings (payout ratio of 9.7%) and cash flows (cash payout ratio of 13.5%), have been volatile over the past decade, indicating an unstable track record. The stock trades at a significant discount to its estimated fair value, suggesting potential undervaluation. However, its dividend yield of 3.9% is below the top tier in the French market and high debt levels could pose risks to financial stability.
- Unlock comprehensive insights into our analysis of Burelle stock in this dividend report.
- Our valuation report unveils the possibility Burelle's shares may be trading at a discount.

Taaleri Oyj (HLSE:TAALA)
Simply Wall St Dividend Rating: ★★★★☆☆
Overview: Taaleri Oyj is a publicly owned asset management holding company with a market cap of €204.62 million.
Operations: Taaleri Oyj's revenue primarily comes from its Private Asset Management segment, which includes Renewable Energy (€40.24 million) and Other Private Asset Management (€3.74 million), as well as its Garantia segment (€19.54 million).
Dividend Yield: 6.9%
Taaleri Oyj's dividend yield of 6.88% ranks in the top 25% of Finnish payers, yet its sustainability is questionable due to a high cash payout ratio of 325.2%, indicating dividends aren't well covered by cash flows. Despite trading at a significant discount to estimated fair value, past dividend volatility and recent earnings decline—net income for nine months fell to €14.56 million from €21.44 million—highlight potential risks for investors seeking stable income streams.
- Delve into the full analysis dividend report here for a deeper understanding of Taaleri Oyj.
- Our valuation report here indicates Taaleri Oyj may be undervalued.
Key Takeaways
- Click this link to deep-dive into the 224 companies within our Top European Dividend Stocks screener.
- Invested in any of these stocks? Simplify your portfolio management with Simply Wall St and stay ahead with our alerts for any critical updates on your stocks.
- Take control of your financial future using Simply Wall St, offering free, in-depth knowledge of international markets to every investor.
Interested In Other Possibilities?
- Explore high-performing small cap companies that haven't yet garnered significant analyst attention.
- Fuel your portfolio with companies showing strong growth potential, backed by optimistic outlooks both from analysts and management.
- Find companies with promising cash flow potential yet trading below their fair value.
This article by Simply Wall St is general in nature. We provide commentary based on historical data and analyst forecasts only using an unbiased methodology and our articles are not intended to be financial advice. It does not constitute a recommendation to buy or sell any stock, and does not take account of your objectives, or your financial situation. We aim to bring you long-term focused analysis driven by fundamental data. Note that our analysis may not factor in the latest price-sensitive company announcements or qualitative material. Simply Wall St has no position in any stocks mentioned.
Valuation is complex, but we're here to simplify it.
Discover if Burelle might be undervalued or overvalued with our detailed analysis, featuring fair value estimates, potential risks, dividends, insider trades, and its financial condition.
Access Free AnalysisHave feedback on this article? Concerned about the content? Get in touch with us directly. Alternatively, email editorial-team@simplywallst.com
About ENXTPA:BUR
Burelle
Through its subsidiaries, provides automotive equipment in France and internationally.
Good value with adequate balance sheet and pays a dividend.
Market Insights

Advertisement
Community Narratives
The company that turned a verb into a global necessity and basically runs the modern internet, digital ads, smartphones, maps, and AI.
Fair Value US$300.00|8.5% undervalued
OS
Community Contributor
Flowers Foods Pays A Fair Price For Health
Fair Value US$16.12|24.6% undervalued
NV
Community Contributor
TMX Group will thrive with 33.3% profit margin and enduring market moat
Fair Value CA$49.90|0.1% undervalued
LI
Community Contributor