
Advertisement
- Malaysia
- /
- Marine and Shipping
- /
- KLSE:HUBLINE
Hubline Berhad (KLSE:HUBLINE) Has Some Difficulty Using Its Capital Effectively
When it comes to investing, there are some useful financial metrics that can warn us when a business is potentially in trouble. More often than not, we'll see a declining return on capital employed (ROCE) and a declining amount of capital employed. This indicates the company is producing less profit from its investments and its total assets are decreasing. So after glancing at the trends within Hubline Berhad (KLSE:HUBLINE), we weren't too hopeful.
Return On Capital Employed (ROCE): What Is It?
For those who don't know, ROCE is a measure of a company's yearly pre-tax profit (its return), relative to the capital employed in the business. The formula for this calculation on Hubline Berhad is:
Return on Capital Employed = Earnings Before Interest and Tax (EBIT) ÷ (Total Assets - Current Liabilities)
0.012 = RM2.7m ÷ (RM357m - RM130m) (Based on the trailing twelve months to March 2023).
Thus, Hubline Berhad has an ROCE of 1.2%. Ultimately, that's a low return and it under-performs the Shipping industry average of 9.6%.
See our latest analysis for Hubline Berhad
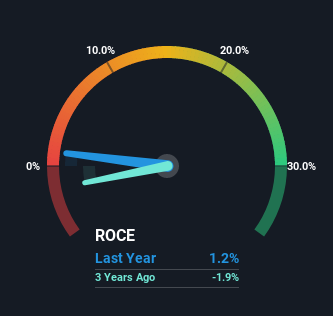
Historical performance is a great place to start when researching a stock so above you can see the gauge for Hubline Berhad's ROCE against it's prior returns. If you want to delve into the historical earnings, revenue and cash flow of Hubline Berhad, check out these free graphs here.
What The Trend Of ROCE Can Tell Us
In terms of Hubline Berhad's historical ROCE movements, the trend doesn't inspire confidence. To be more specific, the ROCE was 3.8% five years ago, but since then it has dropped noticeably. Meanwhile, capital employed in the business has stayed roughly the flat over the period. This combination can be indicative of a mature business that still has areas to deploy capital, but the returns received aren't as high due potentially to new competition or smaller margins. So because these trends aren't typically conducive to creating a multi-bagger, we wouldn't hold our breath on Hubline Berhad becoming one if things continue as they have.
On a side note, Hubline Berhad's current liabilities have increased over the last five years to 36% of total assets, effectively distorting the ROCE to some degree. If current liabilities hadn't increased as much as they did, the ROCE could actually be even lower. Keep an eye on this ratio, because the business could encounter some new risks if this metric gets too high.
What We Can Learn From Hubline Berhad's ROCE
In the end, the trend of lower returns on the same amount of capital isn't typically an indication that we're looking at a growth stock. Long term shareholders who've owned the stock over the last five years have experienced a 59% depreciation in their investment, so it appears the market might not like these trends either. Unless there is a shift to a more positive trajectory in these metrics, we would look elsewhere.
One more thing, we've spotted 2 warning signs facing Hubline Berhad that you might find interesting.
While Hubline Berhad may not currently earn the highest returns, we've compiled a list of companies that currently earn more than 25% return on equity. Check out this free list here.
Valuation is complex, but we're here to simplify it.
Discover if Hubline Berhad might be undervalued or overvalued with our detailed analysis, featuring fair value estimates, potential risks, dividends, insider trades, and its financial condition.
Access Free AnalysisHave feedback on this article? Concerned about the content? Get in touch with us directly. Alternatively, email editorial-team (at) simplywallst.com.
This article by Simply Wall St is general in nature. We provide commentary based on historical data and analyst forecasts only using an unbiased methodology and our articles are not intended to be financial advice. It does not constitute a recommendation to buy or sell any stock, and does not take account of your objectives, or your financial situation. We aim to bring you long-term focused analysis driven by fundamental data. Note that our analysis may not factor in the latest price-sensitive company announcements or qualitative material. Simply Wall St has no position in any stocks mentioned.
About KLSE:HUBLINE
Hubline Berhad
An investment holding company, provides dry bulk shipping services in the South East Asian region.
Slightly overvalued with imperfect balance sheet.
Market Insights

Advertisement
Community Narratives
Finding The True Value Of A Logistics Powerhouse
Fair Value US$95.21|8.4% undervalued
NV
Community Contributor
Paradigm Biopharmaceuticals Will Lead Osteoarthritis Treatment with Zilosul's FDA Success
Fair Value AU$5.50|92.1% undervalued
AM
Community Contributor
Barrick Mining (ABX:CA): A Gold Hedge against a U.S. Shutdown
Fair Value CA$60.00|24.2% undervalued
GM
Community Contributor