
Advertisement
Nexgram Holdings Berhad (KLSE:NEXGRAM) Stock Catapults 33% Though Its Price And Business Still Lag The Industry
Nexgram Holdings Berhad (KLSE:NEXGRAM) shares have had a really impressive month, gaining 33% after a shaky period beforehand. The last 30 days bring the annual gain to a very sharp 33%.
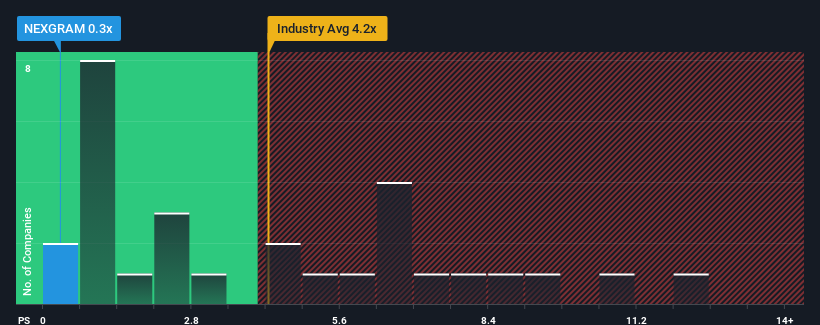
Even after such a large jump in price, Nexgram Holdings Berhad may still be sending very bullish signals at the moment with its price-to-sales (or "P/S") ratio of 0.3x, since almost half of all companies in the Software industry in Malaysia have P/S ratios greater than 4.2x and even P/S higher than 7x are not unusual. Although, it's not wise to just take the P/S at face value as there may be an explanation why it's so limited.
View our latest analysis for Nexgram Holdings Berhad
What Does Nexgram Holdings Berhad's P/S Mean For Shareholders?
Recent times have been quite advantageous for Nexgram Holdings Berhad as its revenue has been rising very briskly. Perhaps the market is expecting future revenue performance to dwindle, which has kept the P/S suppressed. If you like the company, you'd be hoping this isn't the case so that you could potentially pick up some stock while it's out of favour.
Want the full picture on earnings, revenue and cash flow for the company? Then our free report on Nexgram Holdings Berhad will help you shine a light on its historical performance.What Are Revenue Growth Metrics Telling Us About The Low P/S?
In order to justify its P/S ratio, Nexgram Holdings Berhad would need to produce anemic growth that's substantially trailing the industry.
Retrospectively, the last year delivered an exceptional 53% gain to the company's top line. However, this wasn't enough as the latest three year period has seen the company endure a nasty 16% drop in revenue in aggregate. Accordingly, shareholders would have felt downbeat about the medium-term rates of revenue growth.
Weighing that medium-term revenue trajectory against the broader industry's one-year forecast for expansion of 21% shows it's an unpleasant look.
With this in mind, we understand why Nexgram Holdings Berhad's P/S is lower than most of its industry peers. Nonetheless, there's no guarantee the P/S has reached a floor yet with revenue going in reverse. There's potential for the P/S to fall to even lower levels if the company doesn't improve its top-line growth.
What We Can Learn From Nexgram Holdings Berhad's P/S?
Shares in Nexgram Holdings Berhad have risen appreciably however, its P/S is still subdued. Generally, our preference is to limit the use of the price-to-sales ratio to establishing what the market thinks about the overall health of a company.
Our examination of Nexgram Holdings Berhad confirms that the company's shrinking revenue over the past medium-term is a key factor in its low price-to-sales ratio, given the industry is projected to grow. Right now shareholders are accepting the low P/S as they concede future revenue probably won't provide any pleasant surprises either. If recent medium-term revenue trends continue, it's hard to see the share price moving strongly in either direction in the near future under these circumstances.
It is also worth noting that we have found 4 warning signs for Nexgram Holdings Berhad (3 are a bit unpleasant!) that you need to take into consideration.
If you're unsure about the strength of Nexgram Holdings Berhad's business, why not explore our interactive list of stocks with solid business fundamentals for some other companies you may have missed.
Valuation is complex, but we're here to simplify it.
Discover if Nexgram Holdings Berhad might be undervalued or overvalued with our detailed analysis, featuring fair value estimates, potential risks, dividends, insider trades, and its financial condition.
Access Free AnalysisHave feedback on this article? Concerned about the content? Get in touch with us directly. Alternatively, email editorial-team (at) simplywallst.com.
This article by Simply Wall St is general in nature. We provide commentary based on historical data and analyst forecasts only using an unbiased methodology and our articles are not intended to be financial advice. It does not constitute a recommendation to buy or sell any stock, and does not take account of your objectives, or your financial situation. We aim to bring you long-term focused analysis driven by fundamental data. Note that our analysis may not factor in the latest price-sensitive company announcements or qualitative material. Simply Wall St has no position in any stocks mentioned.
About KLSE:NEXGRAM
Nexgram Holdings Berhad
An investment holding company, provides information technology services in Malaysia and Indonesia.
Flawless balance sheet and slightly overvalued.
Market Insights

Advertisement
Community Narratives
MicroVision will explode future revenue by 380.37% with a vision towards success
Fair Value US$60|98.4% undervalued
TH
Community Contributor
The Indispensable Artery for a New North American Economy
Fair Value CA$132.87|0.6% undervalued
TI
Community Contributor
Recently Updated Narratives
MA


MarkoVT on COVER ·
Q3 Outlook modestly optimistic
Fair Value:JP¥1.65k2.0% overvalued
1 followerusers have followed this narrative
0 commentsusers have commented on this narrative
0 likesusers have liked this narrative
BL


BlackGoat on Alphabet ·
Alphabet: The Under-appreciated Compounder Hiding in Plain Sight
Fair Value:US$324.481.3% undervalued
76 followersusers have followed this narrative
3 commentsusers have commented on this narrative
1 likeusers have liked this narrative
BE


Bejgal on MINISO Group Holding ·
MINISO's fair value is projected at 26.69 with an anticipated PE ratio shift of 20x
Fair Value:US$26.6926.7% undervalued
46 followersusers have followed this narrative
3 commentsusers have commented on this narrative
0 likesusers have liked this narrative
Popular Narratives
OS

oscargarcia on Alphabet ·
The company that turned a verb into a global necessity and basically runs the modern internet, digital ads, smartphones, maps, and AI.
Fair Value:US$3405.9% undervalued
136 followersusers have followed this narrative
6 commentsusers have commented on this narrative
18 likesusers have liked this narrative
TH

TheWallstreetKing on MicroVision ·
MicroVision will explode future revenue by 380.37% with a vision towards success
Fair Value:US$6098.4% undervalued
90 followersusers have followed this narrative
10 commentsusers have commented on this narrative
18 likesusers have liked this narrative
AN


AnalystConsensusTarget on NVIDIA ·
NVDA: Expanding AI Demand Will Drive Major Data Center Investments Through 2026
Fair Value:US$232.7922.6% undervalued
928 followersusers have followed this narrative
6 commentsusers have commented on this narrative
22 likesusers have liked this narrative