
Advertisement
Nexgram Holdings Berhad (KLSE:NEXGRAM) Shares Fly 33% But Investors Aren't Buying For Growth
Nexgram Holdings Berhad (KLSE:NEXGRAM) shareholders would be excited to see that the share price has had a great month, posting a 33% gain and recovering from prior weakness. The last 30 days bring the annual gain to a very sharp 33%.
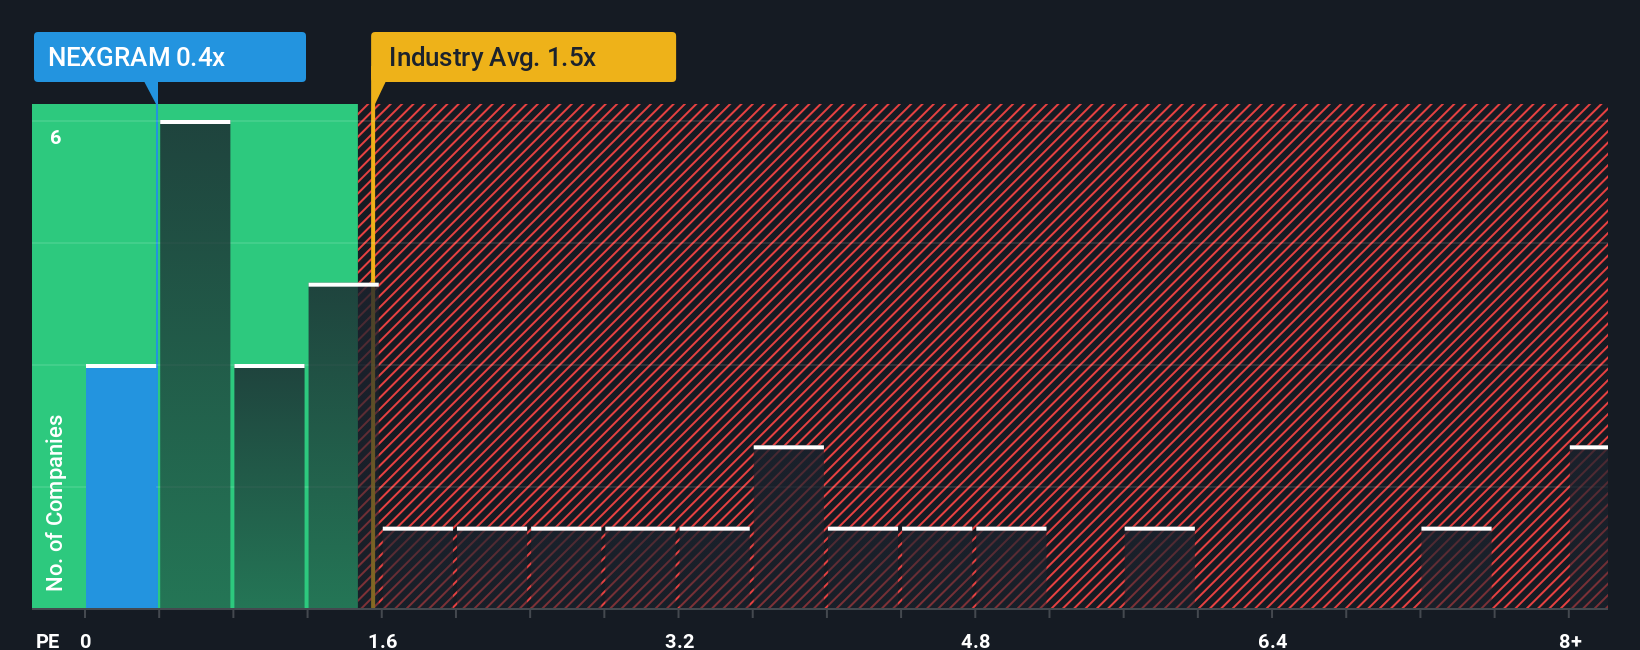
Although its price has surged higher, Nexgram Holdings Berhad may still be sending bullish signals at the moment with its price-to-sales (or "P/S") ratio of 0.4x, since almost half of all companies in the Software industry in Malaysia have P/S ratios greater than 1.5x and even P/S higher than 4x are not unusual. However, the P/S might be low for a reason and it requires further investigation to determine if it's justified.
See our latest analysis for Nexgram Holdings Berhad
How Has Nexgram Holdings Berhad Performed Recently?
For instance, Nexgram Holdings Berhad's receding revenue in recent times would have to be some food for thought. It might be that many expect the disappointing revenue performance to continue or accelerate, which has repressed the P/S. Those who are bullish on Nexgram Holdings Berhad will be hoping that this isn't the case so that they can pick up the stock at a lower valuation.
We don't have analyst forecasts, but you can see how recent trends are setting up the company for the future by checking out our free report on Nexgram Holdings Berhad's earnings, revenue and cash flow.Do Revenue Forecasts Match The Low P/S Ratio?
There's an inherent assumption that a company should underperform the industry for P/S ratios like Nexgram Holdings Berhad's to be considered reasonable.
In reviewing the last year of financials, we were disheartened to see the company's revenues fell to the tune of 12%. Still, the latest three year period has seen an excellent 79% overall rise in revenue, in spite of its unsatisfying short-term performance. So we can start by confirming that the company has generally done a very good job of growing revenue over that time, even though it had some hiccups along the way.
Comparing the recent medium-term revenue trends against the industry's one-year growth forecast of 24% shows it's noticeably less attractive.
With this information, we can see why Nexgram Holdings Berhad is trading at a P/S lower than the industry. It seems most investors are expecting to see the recent limited growth rates continue into the future and are only willing to pay a reduced amount for the stock.
What Does Nexgram Holdings Berhad's P/S Mean For Investors?
Nexgram Holdings Berhad's stock price has surged recently, but its but its P/S still remains modest. It's argued the price-to-sales ratio is an inferior measure of value within certain industries, but it can be a powerful business sentiment indicator.
As we suspected, our examination of Nexgram Holdings Berhad revealed its three-year revenue trends are contributing to its low P/S, given they look worse than current industry expectations. At this stage investors feel the potential for an improvement in revenue isn't great enough to justify a higher P/S ratio. If recent medium-term revenue trends continue, it's hard to see the share price experience a reversal of fortunes anytime soon.
Plus, you should also learn about these 2 warning signs we've spotted with Nexgram Holdings Berhad.
If strong companies turning a profit tickle your fancy, then you'll want to check out this free list of interesting companies that trade on a low P/E (but have proven they can grow earnings).
Valuation is complex, but we're here to simplify it.
Discover if Nexgram Holdings Berhad might be undervalued or overvalued with our detailed analysis, featuring fair value estimates, potential risks, dividends, insider trades, and its financial condition.
Access Free AnalysisHave feedback on this article? Concerned about the content? Get in touch with us directly. Alternatively, email editorial-team (at) simplywallst.com.
This article by Simply Wall St is general in nature. We provide commentary based on historical data and analyst forecasts only using an unbiased methodology and our articles are not intended to be financial advice. It does not constitute a recommendation to buy or sell any stock, and does not take account of your objectives, or your financial situation. We aim to bring you long-term focused analysis driven by fundamental data. Note that our analysis may not factor in the latest price-sensitive company announcements or qualitative material. Simply Wall St has no position in any stocks mentioned.
About KLSE:NEXGRAM
Nexgram Holdings Berhad
An investment holding company, provides information technology services in Malaysia and Indonesia.
Flawless balance sheet and slightly overvalued.
Market Insights

Advertisement
Community Narratives
MicroVision will explode future revenue by 380.37% with a vision towards success
Fair Value US$60|98.4% undervalued
TH
Community Contributor
The Indispensable Artery for a New North American Economy
Fair Value CA$132.87|0.6% undervalued
TI
Community Contributor
Recently Updated Narratives
BL


BlackGoat on Alphabet ·
Alphabet: The Under-appreciated Compounder Hiding in Plain Sight
Fair Value:US$324.481.3% undervalued
76 followersusers have followed this narrative
3 commentsusers have commented on this narrative
1 likeusers have liked this narrative
BE


Bejgal on MINISO Group Holding ·
MINISO's fair value is projected at 26.69 with an anticipated PE ratio shift of 20x
Fair Value:US$26.6926.7% undervalued
46 followersusers have followed this narrative
3 commentsusers have commented on this narrative
0 likesusers have liked this narrative
TI


TickerTickle on Oracle ·
The Quiet Giant That Became AI’s Power Grid
Fair Value:US$389.8147.4% undervalued
9 followersusers have followed this narrative
1 commentusers have commented on this narrative
0 likesusers have liked this narrative
Popular Narratives
OS

oscargarcia on Alphabet ·
The company that turned a verb into a global necessity and basically runs the modern internet, digital ads, smartphones, maps, and AI.
Fair Value:US$3405.9% undervalued
136 followersusers have followed this narrative
6 commentsusers have commented on this narrative
18 likesusers have liked this narrative
TH

TheWallstreetKing on MicroVision ·
MicroVision will explode future revenue by 380.37% with a vision towards success
Fair Value:US$6098.4% undervalued
89 followersusers have followed this narrative
10 commentsusers have commented on this narrative
18 likesusers have liked this narrative
AN


AnalystConsensusTarget on NVIDIA ·
NVDA: Expanding AI Demand Will Drive Major Data Center Investments Through 2026
Fair Value:US$232.7922.6% undervalued
928 followersusers have followed this narrative
6 commentsusers have commented on this narrative
22 likesusers have liked this narrative