Health Check: How Prudently Does Metronic Global Berhad (KLSE:MTRONIC) Use Debt?

Some say volatility, rather than debt, is the best way to think about risk as an investor, but Warren Buffett famously said that 'Volatility is far from synonymous with risk.' So it might be obvious that you need to consider debt, when you think about how risky any given stock is, because too much debt can sink a company. As with many other companies Metronic Global Berhad (KLSE:MTRONIC) makes use of debt. But the real question is whether this debt is making the company risky.
When Is Debt A Problem?
Debt is a tool to help businesses grow, but if a business is incapable of paying off its lenders, then it exists at their mercy. If things get really bad, the lenders can take control of the business. However, a more usual (but still expensive) situation is where a company must dilute shareholders at a cheap share price simply to get debt under control. Of course, plenty of companies use debt to fund growth, without any negative consequences. When we examine debt levels, we first consider both cash and debt levels, together.
Check out our latest analysis for Metronic Global Berhad
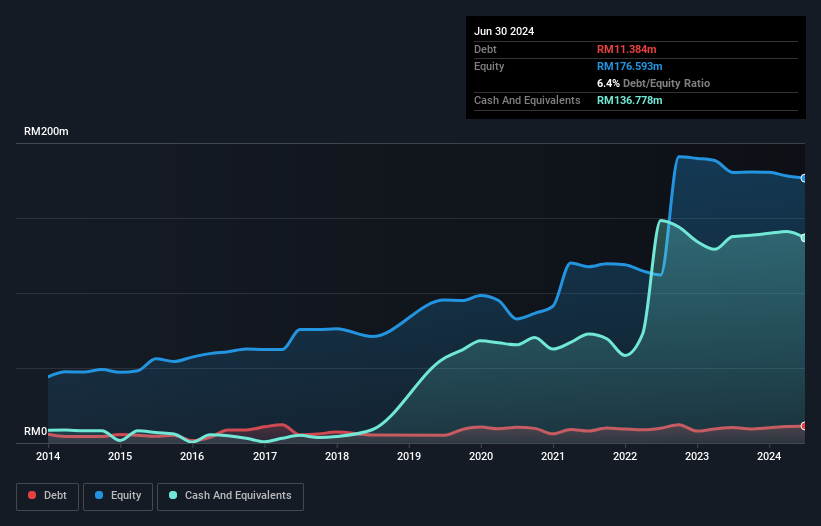
How Much Debt Does Metronic Global Berhad Carry?
As you can see below, at the end of June 2024, Metronic Global Berhad had RM11.4m of debt, up from RM10.3m a year ago. Click the image for more detail. But on the other hand it also has RM136.8m in cash, leading to a RM125.4m net cash position.
How Healthy Is Metronic Global Berhad's Balance Sheet?
We can see from the most recent balance sheet that Metronic Global Berhad had liabilities of RM34.3m falling due within a year, and liabilities of RM133.4k due beyond that. On the other hand, it had cash of RM136.8m and RM23.6m worth of receivables due within a year. So it can boast RM125.9m more liquid assets than total liabilities.
This excess liquidity is a great indication that Metronic Global Berhad's balance sheet is almost as strong as Fort Knox. Having regard to this fact, we think its balance sheet is as strong as an ox. Simply put, the fact that Metronic Global Berhad has more cash than debt is arguably a good indication that it can manage its debt safely. There's no doubt that we learn most about debt from the balance sheet. But you can't view debt in total isolation; since Metronic Global Berhad will need earnings to service that debt. So when considering debt, it's definitely worth looking at the earnings trend. Click here for an interactive snapshot.
In the last year Metronic Global Berhad had a loss before interest and tax, and actually shrunk its revenue by 19%, to RM29m. That's not what we would hope to see.
So How Risky Is Metronic Global Berhad?
By their very nature companies that are losing money are more risky than those with a long history of profitability. And in the last year Metronic Global Berhad had an earnings before interest and tax (EBIT) loss, truth be told. Indeed, in that time it burnt through RM4.1m of cash and made a loss of RM3.7m. While this does make the company a bit risky, it's important to remember it has net cash of RM125.4m. That kitty means the company can keep spending for growth for at least two years, at current rates. Even though its balance sheet seems sufficiently liquid, debt always makes us a little nervous if a company doesn't produce free cash flow regularly. When analysing debt levels, the balance sheet is the obvious place to start. But ultimately, every company can contain risks that exist outside of the balance sheet. We've identified 2 warning signs with Metronic Global Berhad , and understanding them should be part of your investment process.
When all is said and done, sometimes its easier to focus on companies that don't even need debt. Readers can access a list of growth stocks with zero net debt 100% free, right now.
The New Payments ETF Is Live on NASDAQ:
Money is moving to real-time rails, and a newly listed ETF now gives investors direct exposure. Fast settlement. Institutional custody. Simple access.
Explore how this launch could reshape portfolios
Sponsored ContentNew: Manage All Your Stock Portfolios in One Place
We've created the ultimate portfolio companion for stock investors, and it's free.
• Connect an unlimited number of Portfolios and see your total in one currency
• Be alerted to new Warning Signs or Risks via email or mobile
• Track the Fair Value of your stocks
Have feedback on this article? Concerned about the content? Get in touch with us directly. Alternatively, email editorial-team (at) simplywallst.com.
This article by Simply Wall St is general in nature. We provide commentary based on historical data and analyst forecasts only using an unbiased methodology and our articles are not intended to be financial advice. It does not constitute a recommendation to buy or sell any stock, and does not take account of your objectives, or your financial situation. We aim to bring you long-term focused analysis driven by fundamental data. Note that our analysis may not factor in the latest price-sensitive company announcements or qualitative material. Simply Wall St has no position in any stocks mentioned.
About KLSE:MTRONIC
Metronic Global Berhad
An investment holding company, provides engineering and technology solutions in Malaysia and Internationally.
Adequate balance sheet with slight risk.
Similar Companies
Market Insights

Weekly Picks

Early mover in a fast growing industry. Likely to experience share price volatility as they scale


A case for CA$31.80 (undiluted), aka 8,616% upside from CA$0.37 (an 86 bagger!).


Moderation and Stabilisation: HOLD: Fair Price based on a 4-year Cycle is $12.08
Recently Updated Narratives

Airbnb Stock: Platform Growth in a World of Saturation and Scrutiny

Adobe Stock: AI-Fueled ARR Growth Pushes Guidance Higher, But Cost Pressures Loom

Thomson Reuters Stock: When Legal Intelligence Becomes Mission-Critical Infrastructure
Popular Narratives


Crazy Undervalued 42 Baggers Silver Play (Active & Running Mine)


NVDA: Expanding AI Demand Will Drive Major Data Center Investments Through 2026

The AI Infrastructure Giant Grows Into Its Valuation
Trending Discussion


