DynaFront Holdings Berhad (KLSE:DYNAFNT) Stock Has Shown Weakness Lately But Financials Look Strong: Should Prospective Shareholders Make The Leap?

With its stock down 10.0% over the past week, it is easy to disregard DynaFront Holdings Berhad (KLSE:DYNAFNT). However, a closer look at its sound financials might cause you to think again. Given that fundamentals usually drive long-term market outcomes, the company is worth looking at. Particularly, we will be paying attention to DynaFront Holdings Berhad's ROE today.
Return on equity or ROE is a key measure used to assess how efficiently a company's management is utilizing the company's capital. In simpler terms, it measures the profitability of a company in relation to shareholder's equity.
Check out our latest analysis for DynaFront Holdings Berhad
How To Calculate Return On Equity?
ROE can be calculated by using the formula:
Return on Equity = Net Profit (from continuing operations) ÷ Shareholders' Equity
So, based on the above formula, the ROE for DynaFront Holdings Berhad is:
14% = RM2.8m ÷ RM20m (Based on the trailing twelve months to June 2023).
The 'return' is the yearly profit. One way to conceptualize this is that for each MYR1 of shareholders' capital it has, the company made MYR0.14 in profit.
Why Is ROE Important For Earnings Growth?
Thus far, we have learned that ROE measures how efficiently a company is generating its profits. Depending on how much of these profits the company reinvests or "retains", and how effectively it does so, we are then able to assess a company’s earnings growth potential. Generally speaking, other things being equal, firms with a high return on equity and profit retention, have a higher growth rate than firms that don’t share these attributes.
DynaFront Holdings Berhad's Earnings Growth And 14% ROE
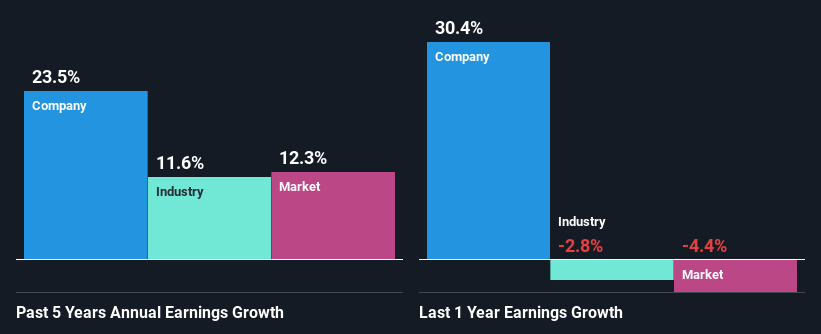
At first glance, DynaFront Holdings Berhad seems to have a decent ROE. Further, the company's ROE compares quite favorably to the industry average of 7.0%. This probably laid the ground for DynaFront Holdings Berhad's significant 24% net income growth seen over the past five years. However, there could also be other causes behind this growth. For instance, the company has a low payout ratio or is being managed efficiently.
We then compared DynaFront Holdings Berhad's net income growth with the industry and we're pleased to see that the company's growth figure is higher when compared with the industry which has a growth rate of 12% in the same 5-year period.
The basis for attaching value to a company is, to a great extent, tied to its earnings growth. It’s important for an investor to know whether the market has priced in the company's expected earnings growth (or decline). By doing so, they will have an idea if the stock is headed into clear blue waters or if swampy waters await. If you're wondering about DynaFront Holdings Berhad's's valuation, check out this gauge of its price-to-earnings ratio, as compared to its industry.
Is DynaFront Holdings Berhad Efficiently Re-investing Its Profits?
DynaFront Holdings Berhad has a significant three-year median payout ratio of 73%, meaning the company only retains 27% of its income. This implies that the company has been able to achieve high earnings growth despite returning most of its profits to shareholders.
While DynaFront Holdings Berhad has seen growth in its earnings, it only recently started to pay a dividend. It is most likely that the company decided to impress new and existing shareholders with a dividend.
Summary
On the whole, we feel that DynaFront Holdings Berhad's performance has been quite good. Especially the high ROE, Which has contributed to the impressive growth seen in earnings. Despite the company reinvesting only a small portion of its profits, it still has managed to grow its earnings so that is appreciable. So far, we've only made a quick discussion around the company's earnings growth. So it may be worth checking this free detailed graph of DynaFront Holdings Berhad's past earnings, as well as revenue and cash flows to get a deeper insight into the company's performance.
The New Payments ETF Is Live on NASDAQ:
Money is moving to real-time rails, and a newly listed ETF now gives investors direct exposure. Fast settlement. Institutional custody. Simple access.
Explore how this launch could reshape portfolios
Sponsored ContentNew: Manage All Your Stock Portfolios in One Place
We've created the ultimate portfolio companion for stock investors, and it's free.
• Connect an unlimited number of Portfolios and see your total in one currency
• Be alerted to new Warning Signs or Risks via email or mobile
• Track the Fair Value of your stocks
Have feedback on this article? Concerned about the content? Get in touch with us directly. Alternatively, email editorial-team (at) simplywallst.com.
This article by Simply Wall St is general in nature. We provide commentary based on historical data and analyst forecasts only using an unbiased methodology and our articles are not intended to be financial advice. It does not constitute a recommendation to buy or sell any stock, and does not take account of your objectives, or your financial situation. We aim to bring you long-term focused analysis driven by fundamental data. Note that our analysis may not factor in the latest price-sensitive company announcements or qualitative material. Simply Wall St has no position in any stocks mentioned.
About KLSE:DYNAFNT
DynaFront Holdings Berhad
An investment holding company, engages in the provision of proprietary software, managed services, and other technology solutions and consulting services for life insurance companies, Takaful operators, and independent corporate life insurance agencies.
Flawless balance sheet low.
Market Insights

Weekly Picks

Early mover in a fast growing industry. Likely to experience share price volatility as they scale


A case for CA$31.80 (undiluted), aka 8,616% upside from CA$0.37 (an 86 bagger!).


Moderation and Stabilisation: HOLD: Fair Price based on a 4-year Cycle is $12.08
Recently Updated Narratives

Airbnb Stock: Platform Growth in a World of Saturation and Scrutiny

Adobe Stock: AI-Fueled ARR Growth Pushes Guidance Higher, But Cost Pressures Loom

Thomson Reuters Stock: When Legal Intelligence Becomes Mission-Critical Infrastructure
Popular Narratives


Crazy Undervalued 42 Baggers Silver Play (Active & Running Mine)


NVDA: Expanding AI Demand Will Drive Major Data Center Investments Through 2026

The AI Infrastructure Giant Grows Into Its Valuation
Trending Discussion


