- Malaysia
- /
- Semiconductors
- /
- KLSE:MPI
Results: Malaysian Pacific Industries Berhad Exceeded Expectations And The Consensus Has Updated Its Estimates
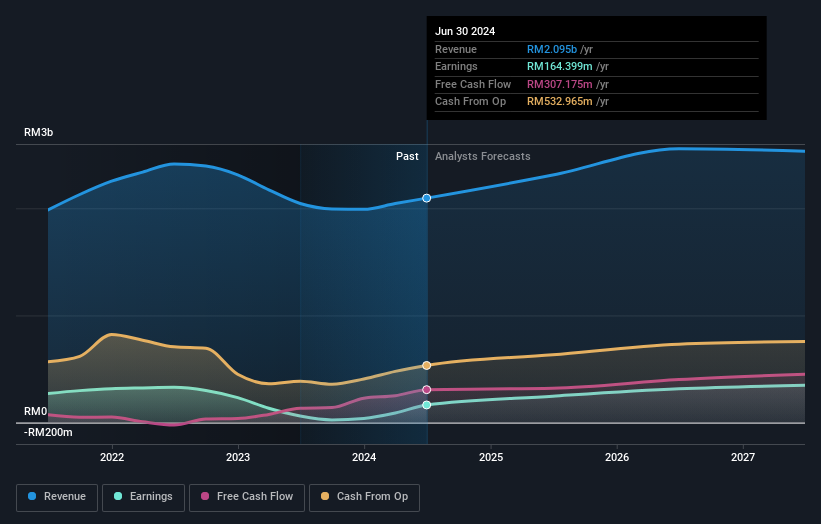
It's been a sad week for Malaysian Pacific Industries Berhad (KLSE:MPI), who've watched their investment drop 17% to RM29.60 in the week since the company reported its yearly result. Revenues RM2.1b disappointed slightly, at3.2% below what the analysts had predicted. Profits were a relative bright spot, with statutory per-share earnings of RM0.83 coming in 10% above what was anticipated. Following the result, the analysts have updated their earnings model, and it would be good to know whether they think there's been a strong change in the company's prospects, or if it's business as usual. So we collected the latest post-earnings statutory consensus estimates to see what could be in store for next year.
Check out our latest analysis for Malaysian Pacific Industries Berhad

Taking into account the latest results, the current consensus from Malaysian Pacific Industries Berhad's six analysts is for revenues of RM2.31b in 2025. This would reflect a solid 10% increase on its revenue over the past 12 months. Per-share earnings are expected to leap 47% to RM1.21. Before this earnings report, the analysts had been forecasting revenues of RM2.41b and earnings per share (EPS) of RM1.26 in 2025. The analysts are less bullish than they were before these results, given the reduced revenue forecasts and the minor downgrade to earnings per share expectations.
Despite the cuts to forecast earnings, there was no real change to the RM40.65 price target, showing that the analysts don't think the changes have a meaningful impact on its intrinsic value. That's not the only conclusion we can draw from this data however, as some investors also like to consider the spread in estimates when evaluating analyst price targets. Currently, the most bullish analyst values Malaysian Pacific Industries Berhad at RM48.50 per share, while the most bearish prices it at RM27.40. This shows there is still a bit of diversity in estimates, but analysts don't appear to be totally split on the stock as though it might be a success or failure situation.
Another way we can view these estimates is in the context of the bigger picture, such as how the forecasts stack up against past performance, and whether forecasts are more or less bullish relative to other companies in the industry. It's clear from the latest estimates that Malaysian Pacific Industries Berhad's rate of growth is expected to accelerate meaningfully, with the forecast 10% annualised revenue growth to the end of 2025 noticeably faster than its historical growth of 8.1% p.a. over the past five years. Compare this with other companies in the same industry, which are forecast to see revenue growth of 13% annually. So it's clear that despite the acceleration in growth, Malaysian Pacific Industries Berhad is expected to grow meaningfully slower than the industry average.
The Bottom Line
The most important thing to take away is that the analysts downgraded their earnings per share estimates, showing that there has been a clear decline in sentiment following these results. Unfortunately, they also downgraded their revenue estimates, and our data indicates underperformance compared to the wider industry. Even so, earnings per share are more important to the intrinsic value of the business. There was no real change to the consensus price target, suggesting that the intrinsic value of the business has not undergone any major changes with the latest estimates.
Following on from that line of thought, we think that the long-term prospects of the business are much more relevant than next year's earnings. We have estimates - from multiple Malaysian Pacific Industries Berhad analysts - going out to 2027, and you can see them free on our platform here.
Another thing to consider is whether management and directors have been buying or selling stock recently. We provide an overview of all open market stock trades for the last twelve months on our platform, here.
New: Manage All Your Stock Portfolios in One Place
We've created the ultimate portfolio companion for stock investors, and it's free.
• Connect an unlimited number of Portfolios and see your total in one currency
• Be alerted to new Warning Signs or Risks via email or mobile
• Track the Fair Value of your stocks
Have feedback on this article? Concerned about the content? Get in touch with us directly. Alternatively, email editorial-team (at) simplywallst.com.
This article by Simply Wall St is general in nature. We provide commentary based on historical data and analyst forecasts only using an unbiased methodology and our articles are not intended to be financial advice. It does not constitute a recommendation to buy or sell any stock, and does not take account of your objectives, or your financial situation. We aim to bring you long-term focused analysis driven by fundamental data. Note that our analysis may not factor in the latest price-sensitive company announcements or qualitative material. Simply Wall St has no position in any stocks mentioned.
About KLSE:MPI
Malaysian Pacific Industries Berhad
An investment holding company, engages in the manufacturing, assembling, testing, marketing, and sale of integrated circuits, semiconductor devices, electronic components, and lead frames.
Excellent balance sheet and slightly overvalued.
Market Insights
Community Narratives


