
Advertisement
- Malaysia
- /
- Specialty Stores
- /
- KLSE:KAMDAR
Kamdar Group (M) Berhad (KLSE:KAMDAR) Shares May Have Slumped 29% But Getting In Cheap Is Still Unlikely
The Kamdar Group (M) Berhad (KLSE:KAMDAR) share price has fared very poorly over the last month, falling by a substantial 29%. Still, a bad month hasn't completely ruined the past year with the stock gaining 39%, which is great even in a bull market.
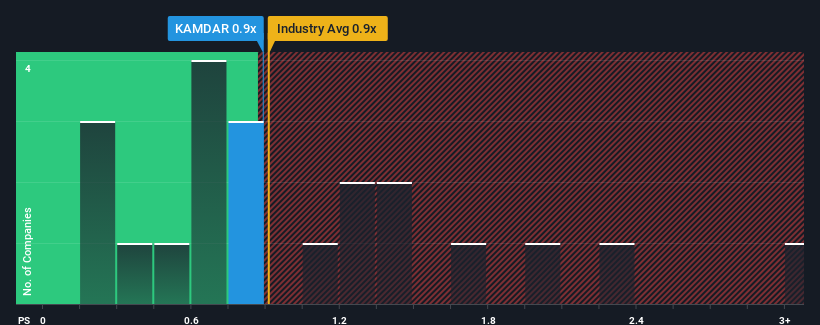
In spite of the heavy fall in price, you could still be forgiven for feeling indifferent about Kamdar Group (M) Berhad's P/S ratio of 0.9x, since the median price-to-sales (or "P/S") ratio for the Specialty Retail industry in Malaysia is about the same. Although, it's not wise to simply ignore the P/S without explanation as investors may be disregarding a distinct opportunity or a costly mistake.
Check out our latest analysis for Kamdar Group (M) Berhad
What Does Kamdar Group (M) Berhad's P/S Mean For Shareholders?
For instance, Kamdar Group (M) Berhad's receding revenue in recent times would have to be some food for thought. It might be that many expect the company to put the disappointing revenue performance behind them over the coming period, which has kept the P/S from falling. If you like the company, you'd at least be hoping this is the case so that you could potentially pick up some stock while it's not quite in favour.
Although there are no analyst estimates available for Kamdar Group (M) Berhad, take a look at this free data-rich visualisation to see how the company stacks up on earnings, revenue and cash flow.Is There Some Revenue Growth Forecasted For Kamdar Group (M) Berhad?
Kamdar Group (M) Berhad's P/S ratio would be typical for a company that's only expected to deliver moderate growth, and importantly, perform in line with the industry.
Taking a look back first, the company's revenue growth last year wasn't something to get excited about as it posted a disappointing decline of 19%. This means it has also seen a slide in revenue over the longer-term as revenue is down 23% in total over the last three years. Therefore, it's fair to say the revenue growth recently has been undesirable for the company.
Weighing that medium-term revenue trajectory against the broader industry's one-year forecast for expansion of 14% shows it's an unpleasant look.
With this information, we find it concerning that Kamdar Group (M) Berhad is trading at a fairly similar P/S compared to the industry. It seems most investors are ignoring the recent poor growth rate and are hoping for a turnaround in the company's business prospects. Only the boldest would assume these prices are sustainable as a continuation of recent revenue trends is likely to weigh on the share price eventually.
What Does Kamdar Group (M) Berhad's P/S Mean For Investors?
Following Kamdar Group (M) Berhad's share price tumble, its P/S is just clinging on to the industry median P/S. It's argued the price-to-sales ratio is an inferior measure of value within certain industries, but it can be a powerful business sentiment indicator.
Our look at Kamdar Group (M) Berhad revealed its shrinking revenues over the medium-term haven't impacted the P/S as much as we anticipated, given the industry is set to grow. When we see revenue heading backwards in the context of growing industry forecasts, it'd make sense to expect a possible share price decline on the horizon, sending the moderate P/S lower. Unless the recent medium-term conditions improve markedly, investors will have a hard time accepting the share price as fair value.
It's always necessary to consider the ever-present spectre of investment risk. We've identified 3 warning signs with Kamdar Group (M) Berhad (at least 2 which are concerning), and understanding them should be part of your investment process.
If you're unsure about the strength of Kamdar Group (M) Berhad's business, why not explore our interactive list of stocks with solid business fundamentals for some other companies you may have missed.
Valuation is complex, but we're here to simplify it.
Discover if Kamdar Group (M) Berhad might be undervalued or overvalued with our detailed analysis, featuring fair value estimates, potential risks, dividends, insider trades, and its financial condition.
Access Free AnalysisHave feedback on this article? Concerned about the content? Get in touch with us directly. Alternatively, email editorial-team (at) simplywallst.com.
This article by Simply Wall St is general in nature. We provide commentary based on historical data and analyst forecasts only using an unbiased methodology and our articles are not intended to be financial advice. It does not constitute a recommendation to buy or sell any stock, and does not take account of your objectives, or your financial situation. We aim to bring you long-term focused analysis driven by fundamental data. Note that our analysis may not factor in the latest price-sensitive company announcements or qualitative material. Simply Wall St has no position in any stocks mentioned.
About KLSE:KAMDAR
Kamdar Group (M) Berhad
An investment holding company, engages in the import, export, retail, and wholesale of textile and textile-based products in Malaysia.
Flawless balance sheet with low risk.
Market Insights

Advertisement
Community Narratives
MINISO's fair value is projected at 26.69 with an anticipated PE ratio shift of 20x
Fair Value US$24.03|11.0% undervalued
BE
Community Contributor
Procter & Gamble: A Dividend Giant Facing Slowing Growth
Fair Value US$119.81|23.3% overvalued
AN
Community Contributor
Eli Lilly's Future Growth Driven by Tirzepatide and Favorable Market Conditions
Fair Value US$1.19k|13.8% undervalued
EA
Community Contributor