
Advertisement
- Malaysia
- /
- Retail Distributors
- /
- KLSE:JOE
Joe Holding Berhad (KLSE:JOE) Is In A Good Position To Deliver On Growth Plans
We can readily understand why investors are attracted to unprofitable companies. For example, although software-as-a-service business Salesforce.com lost money for years while it grew recurring revenue, if you held shares since 2005, you'd have done very well indeed. But the harsh reality is that very many loss making companies burn through all their cash and go bankrupt.
So, the natural question for Joe Holding Berhad (KLSE:JOE) shareholders is whether they should be concerned by its rate of cash burn. For the purpose of this article, we'll define cash burn as the amount of cash the company is spending each year to fund its growth (also called its negative free cash flow). Let's start with an examination of the business' cash, relative to its cash burn.
See our latest analysis for Joe Holding Berhad
How Long Is Joe Holding Berhad's Cash Runway?
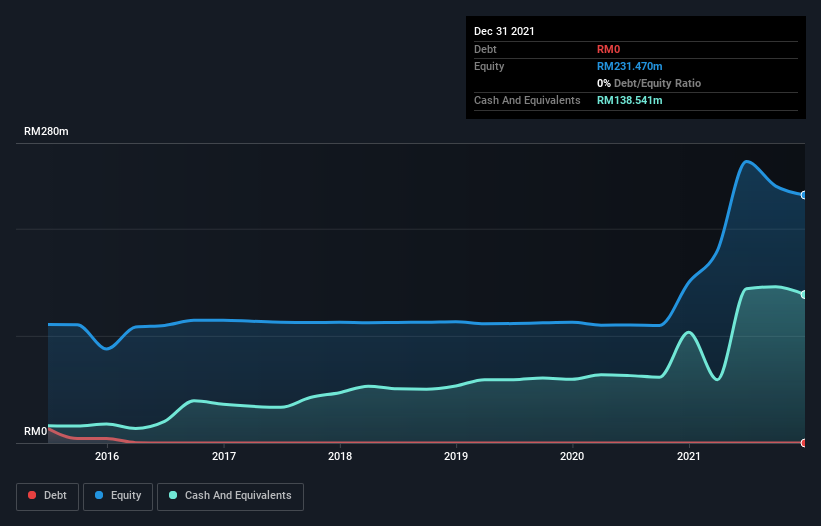
A company's cash runway is the amount of time it would take to burn through its cash reserves at its current cash burn rate. In December 2021, Joe Holding Berhad had RM139m in cash, and was debt-free. Importantly, its cash burn was RM26m over the trailing twelve months. Therefore, from December 2021 it had 5.3 years of cash runway. While this is only one measure of its cash burn situation, it certainly gives us the impression that holders have nothing to worry about. The image below shows how its cash balance has been changing over the last few years.
Is Joe Holding Berhad's Revenue Growing?
We're hesitant to extrapolate on the recent trend to assess its cash burn, because Joe Holding Berhad actually had positive free cash flow last year, so operating revenue growth is probably our best bet to measure, right now. Regrettably, the company's operating revenue moved in the wrong direction over the last twelve months, declining by 33%. Of course, we've only taken a quick look at the stock's growth metrics, here. This graph of historic earnings and revenue shows how Joe Holding Berhad is building its business over time.
Can Joe Holding Berhad Raise More Cash Easily?
Since its revenue growth is moving in the wrong direction, Joe Holding Berhad shareholders may wish to think ahead to when the company may need to raise more cash. Issuing new shares, or taking on debt, are the most common ways for a listed company to raise more money for its business. Many companies end up issuing new shares to fund future growth. By looking at a company's cash burn relative to its market capitalisation, we gain insight on how much shareholders would be diluted if the company needed to raise enough cash to cover another year's cash burn.
Since it has a market capitalisation of RM92m, Joe Holding Berhad's RM26m in cash burn equates to about 29% of its market value. That's not insignificant, and if the company had to sell enough shares to fund another year's growth at the current share price, you'd likely witness fairly costly dilution.
How Risky Is Joe Holding Berhad's Cash Burn Situation?
Even though its falling revenue makes us a little nervous, we are compelled to mention that we thought Joe Holding Berhad's cash runway was relatively promising. While we're the kind of investors who are always a bit concerned about the risks involved with cash burning companies, the metrics we have discussed in this article leave us relatively comfortable about Joe Holding Berhad's situation. Taking a deeper dive, we've spotted 4 warning signs for Joe Holding Berhad you should be aware of, and 2 of them are potentially serious.
If you would prefer to check out another company with better fundamentals, then do not miss this free list of interesting companies, that have HIGH return on equity and low debt or this list of stocks which are all forecast to grow.
New: Manage All Your Stock Portfolios in One Place
We've created the ultimate portfolio companion for stock investors, and it's free.
• Connect an unlimited number of Portfolios and see your total in one currency
• Be alerted to new Warning Signs or Risks via email or mobile
• Track the Fair Value of your stocks
Have feedback on this article? Concerned about the content? Get in touch with us directly. Alternatively, email editorial-team (at) simplywallst.com.
This article by Simply Wall St is general in nature. We provide commentary based on historical data and analyst forecasts only using an unbiased methodology and our articles are not intended to be financial advice. It does not constitute a recommendation to buy or sell any stock, and does not take account of your objectives, or your financial situation. We aim to bring you long-term focused analysis driven by fundamental data. Note that our analysis may not factor in the latest price-sensitive company announcements or qualitative material. Simply Wall St has no position in any stocks mentioned.
About KLSE:JOE
Joe Holding Berhad
Supplies automotive batteries in Malaysia and internationally.
Excellent balance sheet with slight risk.
Market Insights

Advertisement
Community Narratives
MINISO's fair value is projected at 26.69 with an anticipated PE ratio shift of 20x
Fair Value US$24.03|11.0% undervalued
BE
Community Contributor
Procter & Gamble: A Dividend Giant Facing Slowing Growth
Fair Value US$119.81|23.3% overvalued
AN
Community Contributor
Eli Lilly's Future Growth Driven by Tirzepatide and Favorable Market Conditions
Fair Value US$1.19k|13.8% undervalued
EA
Community Contributor