
Advertisement
- Malaysia
- /
- Real Estate
- /
- KLSE:SPSETIA
S P Setia Berhad (KLSE:SPSETIA) jumps 9.1% this week, though earnings growth is still tracking behind three-year shareholder returns
By buying an index fund, investors can approximate the average market return. But many of us dare to dream of bigger returns, and build a portfolio ourselves. For example, the S P Setia Berhad (KLSE:SPSETIA) share price is up 85% in the last three years, clearly besting the market return of around 16% (not including dividends).
After a strong gain in the past week, it's worth seeing if longer term returns have been driven by improving fundamentals.
To paraphrase Benjamin Graham: Over the short term the market is a voting machine, but over the long term it's a weighing machine. One way to examine how market sentiment has changed over time is to look at the interaction between a company's share price and its earnings per share (EPS).
During three years of share price growth, S P Setia Berhad achieved compound earnings per share growth of 16% per year. This EPS growth is lower than the 23% average annual increase in the share price. This indicates that the market is feeling more optimistic on the stock, after the last few years of progress. It is quite common to see investors become enamoured with a business, after a few years of solid progress.
The company's earnings per share (over time) is depicted in the image below (click to see the exact numbers).
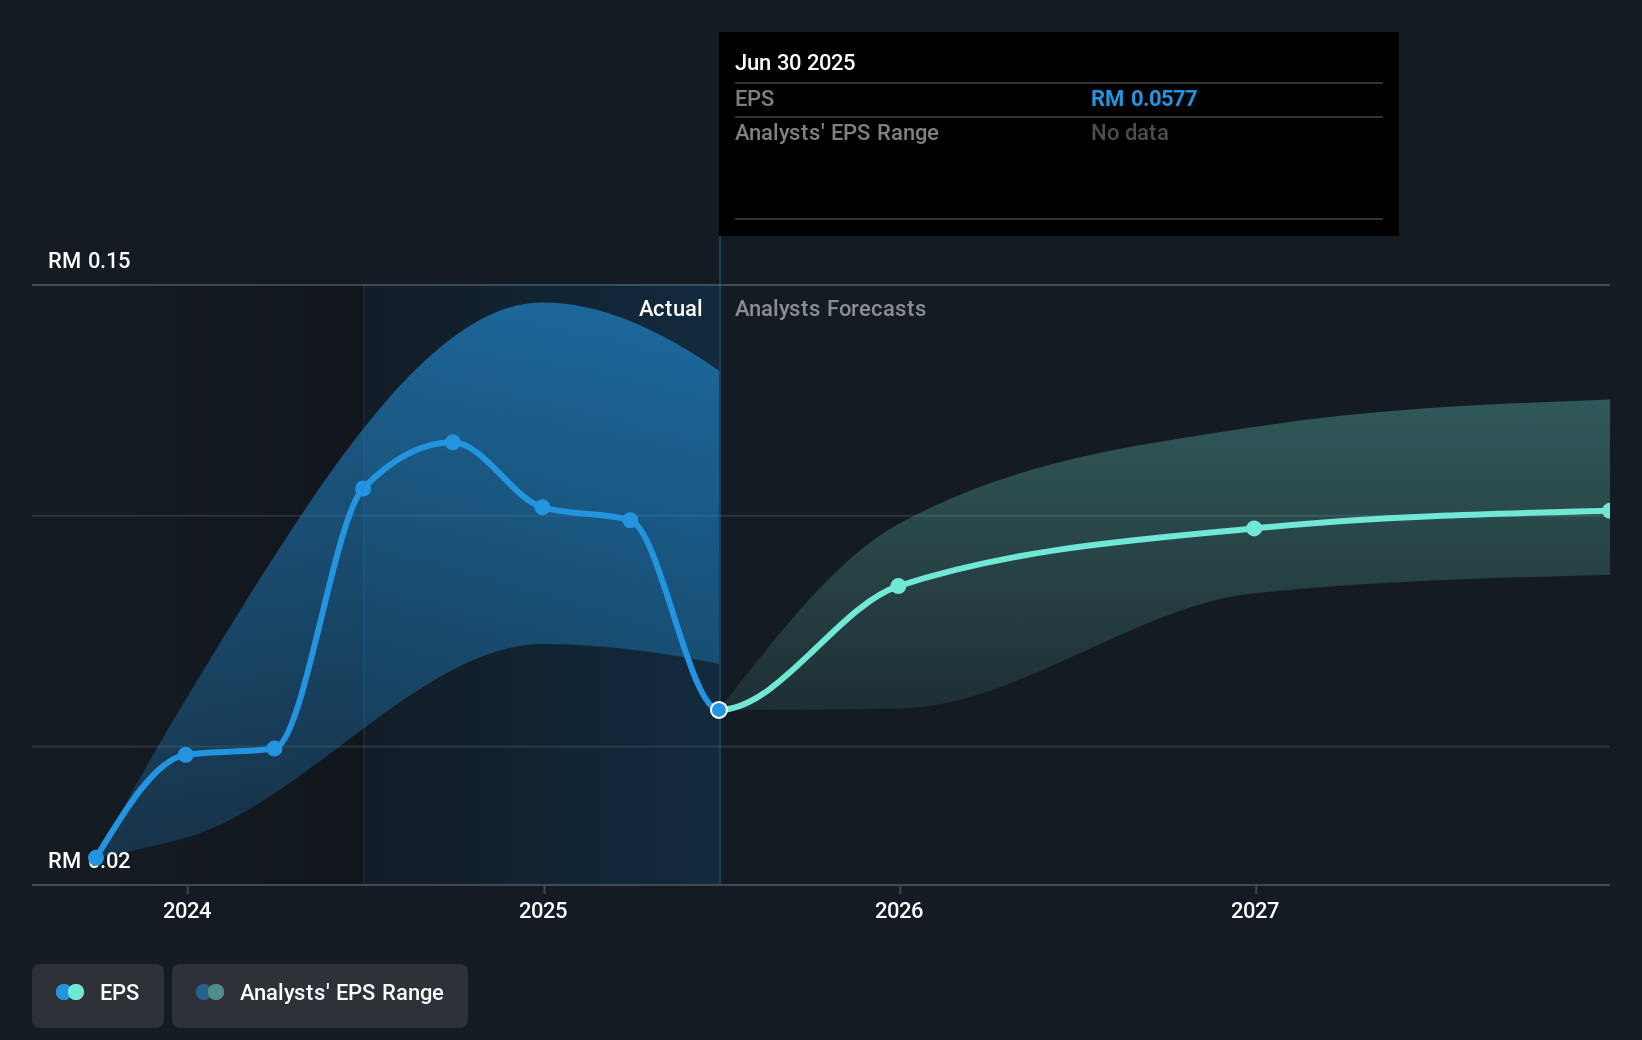
This free interactive report on S P Setia Berhad's earnings, revenue and cash flow is a great place to start, if you want to investigate the stock further.
What About Dividends?
As well as measuring the share price return, investors should also consider the total shareholder return (TSR). The TSR incorporates the value of any spin-offs or discounted capital raisings, along with any dividends, based on the assumption that the dividends are reinvested. Arguably, the TSR gives a more comprehensive picture of the return generated by a stock. In the case of S P Setia Berhad, it has a TSR of 96% for the last 3 years. That exceeds its share price return that we previously mentioned. And there's no prize for guessing that the dividend payments largely explain the divergence!
A Different Perspective
While the broader market lost about 0.5% in the twelve months, S P Setia Berhad shareholders did even worse, losing 17% (even including dividends). However, it could simply be that the share price has been impacted by broader market jitters. It might be worth keeping an eye on the fundamentals, in case there's a good opportunity. On the bright side, long term shareholders have made money, with a gain of 9% per year over half a decade. It could be that the recent sell-off is an opportunity, so it may be worth checking the fundamental data for signs of a long term growth trend. It's always interesting to track share price performance over the longer term. But to understand S P Setia Berhad better, we need to consider many other factors. Take risks, for example - S P Setia Berhad has 1 warning sign we think you should be aware of.
But note: S P Setia Berhad may not be the best stock to buy. So take a peek at this free list of interesting companies with past earnings growth (and further growth forecast).
Please note, the market returns quoted in this article reflect the market weighted average returns of stocks that currently trade on Malaysian exchanges.
New: Manage All Your Stock Portfolios in One Place
We've created the ultimate portfolio companion for stock investors, and it's free.
• Connect an unlimited number of Portfolios and see your total in one currency
• Be alerted to new Warning Signs or Risks via email or mobile
• Track the Fair Value of your stocks
Have feedback on this article? Concerned about the content? Get in touch with us directly. Alternatively, email editorial-team (at) simplywallst.com.
This article by Simply Wall St is general in nature. We provide commentary based on historical data and analyst forecasts only using an unbiased methodology and our articles are not intended to be financial advice. It does not constitute a recommendation to buy or sell any stock, and does not take account of your objectives, or your financial situation. We aim to bring you long-term focused analysis driven by fundamental data. Note that our analysis may not factor in the latest price-sensitive company announcements or qualitative material. Simply Wall St has no position in any stocks mentioned.
About KLSE:SPSETIA
S P Setia Berhad
An investment holding company, operates as a property development and investment company in Malaysia, Singapore, Australia, Vietnam, the United Kingdom, and Japan.
Excellent balance sheet with moderate growth potential.
Market Insights

Advertisement
Community Narratives
MINISO's fair value is projected at 26.69 with an anticipated PE ratio shift of 20x
Fair Value US$24.03|11.0% undervalued
BE
Community Contributor
Procter & Gamble: A Dividend Giant Facing Slowing Growth
Fair Value US$119.81|23.3% overvalued
AN
Community Contributor
Eli Lilly's Future Growth Driven by Tirzepatide and Favorable Market Conditions
Fair Value US$1.19k|13.8% undervalued
EA
Community Contributor