
Advertisement
- Malaysia
- /
- Real Estate
- /
- KLSE:SIMEPROP
Sime Darby Property Berhad (KLSE:SIMEPROP) sheds 5.8% this week, as yearly returns fall more in line with earnings growth
Passive investing in index funds can generate returns that roughly match the overall market. But one can do better than that by picking better than average stocks (as part of a diversified portfolio). To wit, the Sime Darby Property Berhad (KLSE:SIMEPROP) share price is 87% higher than it was a year ago, much better than the market return of around 9.7% (not including dividends) in the same period. So that should have shareholders smiling. It is also impressive that the stock is up 37% over three years, adding to the sense that it is a real winner.
Since the long term performance has been good but there's been a recent pullback of 5.8%, let's check if the fundamentals match the share price.
See our latest analysis for Sime Darby Property Berhad
To quote Buffett, 'Ships will sail around the world but the Flat Earth Society will flourish. There will continue to be wide discrepancies between price and value in the marketplace...' One flawed but reasonable way to assess how sentiment around a company has changed is to compare the earnings per share (EPS) with the share price.
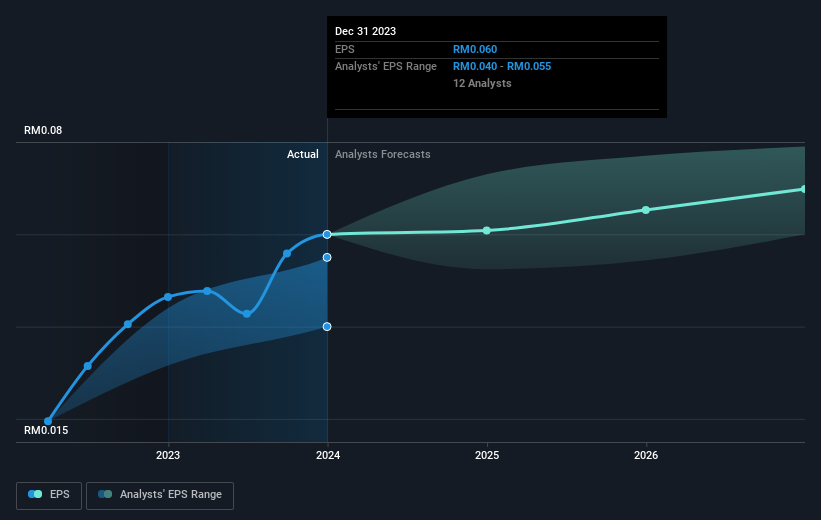
During the last year Sime Darby Property Berhad grew its earnings per share (EPS) by 29%. This EPS growth is significantly lower than the 87% increase in the share price. So it's fair to assume the market has a higher opinion of the business than it a year ago.
The image below shows how EPS has tracked over time (if you click on the image you can see greater detail).
We know that Sime Darby Property Berhad has improved its bottom line over the last three years, but what does the future have in store? Take a more thorough look at Sime Darby Property Berhad's financial health with this free report on its balance sheet.
What About Dividends?
As well as measuring the share price return, investors should also consider the total shareholder return (TSR). The TSR incorporates the value of any spin-offs or discounted capital raisings, along with any dividends, based on the assumption that the dividends are reinvested. It's fair to say that the TSR gives a more complete picture for stocks that pay a dividend. We note that for Sime Darby Property Berhad the TSR over the last 1 year was 93%, which is better than the share price return mentioned above. And there's no prize for guessing that the dividend payments largely explain the divergence!
A Different Perspective
We're pleased to report that Sime Darby Property Berhad shareholders have received a total shareholder return of 93% over one year. Of course, that includes the dividend. Notably the five-year annualised TSR loss of 1.8% per year compares very unfavourably with the recent share price performance. We generally put more weight on the long term performance over the short term, but the recent improvement could hint at a (positive) inflection point within the business. While it is well worth considering the different impacts that market conditions can have on the share price, there are other factors that are even more important. To that end, you should be aware of the 1 warning sign we've spotted with Sime Darby Property Berhad .
If you would prefer to check out another company -- one with potentially superior financials -- then do not miss this free list of companies that have proven they can grow earnings.
Please note, the market returns quoted in this article reflect the market weighted average returns of stocks that currently trade on Malaysian exchanges.
New: Manage All Your Stock Portfolios in One Place
We've created the ultimate portfolio companion for stock investors, and it's free.
• Connect an unlimited number of Portfolios and see your total in one currency
• Be alerted to new Warning Signs or Risks via email or mobile
• Track the Fair Value of your stocks
Have feedback on this article? Concerned about the content? Get in touch with us directly. Alternatively, email editorial-team (at) simplywallst.com.
This article by Simply Wall St is general in nature. We provide commentary based on historical data and analyst forecasts only using an unbiased methodology and our articles are not intended to be financial advice. It does not constitute a recommendation to buy or sell any stock, and does not take account of your objectives, or your financial situation. We aim to bring you long-term focused analysis driven by fundamental data. Note that our analysis may not factor in the latest price-sensitive company announcements or qualitative material. Simply Wall St has no position in any stocks mentioned.
About KLSE:SIMEPROP
Sime Darby Property Berhad
An investment holding company, engages in the property development business in Malaysia, Singapore, and the United Kingdom.
Adequate balance sheet with moderate growth potential.
Market Insights

Advertisement
Community Narratives
MINISO's fair value is projected at 26.69 with an anticipated PE ratio shift of 20x
Fair Value US$24.03|11.0% undervalued
BE
Community Contributor
Procter & Gamble: A Dividend Giant Facing Slowing Growth
Fair Value US$119.81|23.3% overvalued
AN
Community Contributor
Eli Lilly's Future Growth Driven by Tirzepatide and Favorable Market Conditions
Fair Value US$1.19k|13.8% undervalued
EA
Community Contributor