- Malaysia
- /
- Paper and Forestry Products
- /
- KLSE:WTK
Is W T K Holdings Berhad (KLSE:WTK) Using Debt In A Risky Way?

Some say volatility, rather than debt, is the best way to think about risk as an investor, but Warren Buffett famously said that 'Volatility is far from synonymous with risk.' It's only natural to consider a company's balance sheet when you examine how risky it is, since debt is often involved when a business collapses. We can see that W T K Holdings Berhad (KLSE:WTK) does use debt in its business. But is this debt a concern to shareholders?
What Risk Does Debt Bring?
Generally speaking, debt only becomes a real problem when a company can't easily pay it off, either by raising capital or with its own cash flow. Part and parcel of capitalism is the process of 'creative destruction' where failed businesses are mercilessly liquidated by their bankers. However, a more common (but still painful) scenario is that it has to raise new equity capital at a low price, thus permanently diluting shareholders. Of course, plenty of companies use debt to fund growth, without any negative consequences. When we think about a company's use of debt, we first look at cash and debt together.
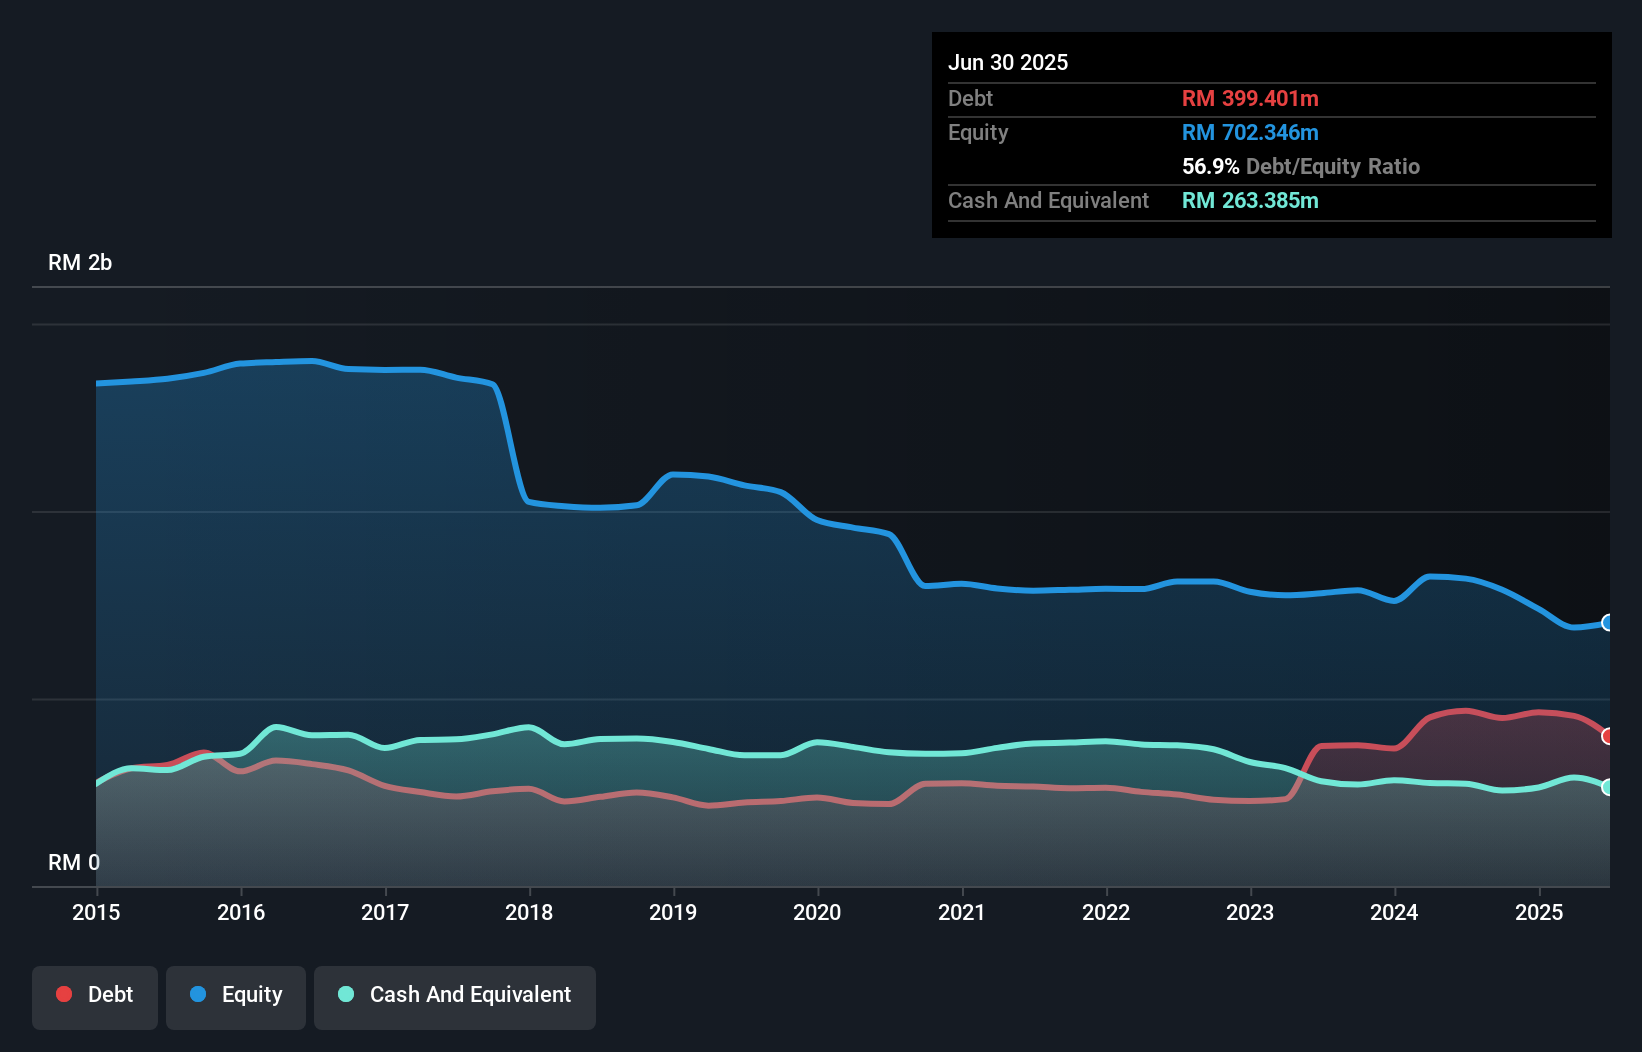
How Much Debt Does W T K Holdings Berhad Carry?
The image below, which you can click on for greater detail, shows that W T K Holdings Berhad had debt of RM399.4m at the end of June 2025, a reduction from RM467.4m over a year. On the flip side, it has RM263.4m in cash leading to net debt of about RM136.0m.
How Strong Is W T K Holdings Berhad's Balance Sheet?
Zooming in on the latest balance sheet data, we can see that W T K Holdings Berhad had liabilities of RM238.7m due within 12 months and liabilities of RM434.5m due beyond that. On the other hand, it had cash of RM263.4m and RM61.9m worth of receivables due within a year. So its liabilities total RM347.8m more than the combination of its cash and short-term receivables.
Given this deficit is actually higher than the company's market capitalization of RM341.5m, we think shareholders really should watch W T K Holdings Berhad's debt levels, like a parent watching their child ride a bike for the first time. In the scenario where the company had to clean up its balance sheet quickly, it seems likely shareholders would suffer extensive dilution. When analysing debt levels, the balance sheet is the obvious place to start. But you can't view debt in total isolation; since W T K Holdings Berhad will need earnings to service that debt. So if you're keen to discover more about its earnings, it might be worth checking out this graph of its long term earnings trend.
See our latest analysis for W T K Holdings Berhad
In the last year W T K Holdings Berhad had a loss before interest and tax, and actually shrunk its revenue by 2.8%, to RM633m. We would much prefer see growth.
Caveat Emptor
Over the last twelve months W T K Holdings Berhad produced an earnings before interest and tax (EBIT) loss. Its EBIT loss was a whopping RM49m. When we look at that alongside the significant liabilities, we're not particularly confident about the company. It would need to improve its operations quickly for us to be interested in it. For example, we would not want to see a repeat of last year's loss of RM54m. And until that time we think this is a risky stock. There's no doubt that we learn most about debt from the balance sheet. However, not all investment risk resides within the balance sheet - far from it. To that end, you should be aware of the 1 warning sign we've spotted with W T K Holdings Berhad .
If you're interested in investing in businesses that can grow profits without the burden of debt, then check out this free list of growing businesses that have net cash on the balance sheet.
The New Payments ETF Is Live on NASDAQ:
Money is moving to real-time rails, and a newly listed ETF now gives investors direct exposure. Fast settlement. Institutional custody. Simple access.
Explore how this launch could reshape portfolios
Sponsored ContentValuation is complex, but we're here to simplify it.
Discover if W T K Holdings Berhad might be undervalued or overvalued with our detailed analysis, featuring fair value estimates, potential risks, dividends, insider trades, and its financial condition.
Access Free AnalysisHave feedback on this article? Concerned about the content? Get in touch with us directly. Alternatively, email editorial-team (at) simplywallst.com.
This article by Simply Wall St is general in nature. We provide commentary based on historical data and analyst forecasts only using an unbiased methodology and our articles are not intended to be financial advice. It does not constitute a recommendation to buy or sell any stock, and does not take account of your objectives, or your financial situation. We aim to bring you long-term focused analysis driven by fundamental data. Note that our analysis may not factor in the latest price-sensitive company announcements or qualitative material. Simply Wall St has no position in any stocks mentioned.
About KLSE:WTK
W T K Holdings Berhad
An investment holding company, operates in the timber industry in Malaysia, Japan, Singapore, Taiwan, Australia, Thailand, and internationally.
Good value with adequate balance sheet.
Market Insights

Weekly Picks

Early mover in a fast growing industry. Likely to experience share price volatility as they scale


A case for CA$31.80 (undiluted), aka 8,616% upside from CA$0.37 (an 86 bagger!).


Moderation and Stabilisation: HOLD: Fair Price based on a 4-year Cycle is $12.08
Recently Updated Narratives

Airbnb Stock: Platform Growth in a World of Saturation and Scrutiny

Adobe Stock: AI-Fueled ARR Growth Pushes Guidance Higher, But Cost Pressures Loom

Thomson Reuters Stock: When Legal Intelligence Becomes Mission-Critical Infrastructure
Popular Narratives


Crazy Undervalued 42 Baggers Silver Play (Active & Running Mine)


NVDA: Expanding AI Demand Will Drive Major Data Center Investments Through 2026

The AI Infrastructure Giant Grows Into Its Valuation
Trending Discussion

