
Advertisement
What You Can Learn From Toyo Ventures Holdings Berhad's (KLSE:TOYOVEN) P/SAfter Its 31% Share Price Crash
Toyo Ventures Holdings Berhad (KLSE:TOYOVEN) shareholders won't be pleased to see that the share price has had a very rough month, dropping 31% and undoing the prior period's positive performance. The drop over the last 30 days has capped off a tough year for shareholders, with the share price down 30% in that time.
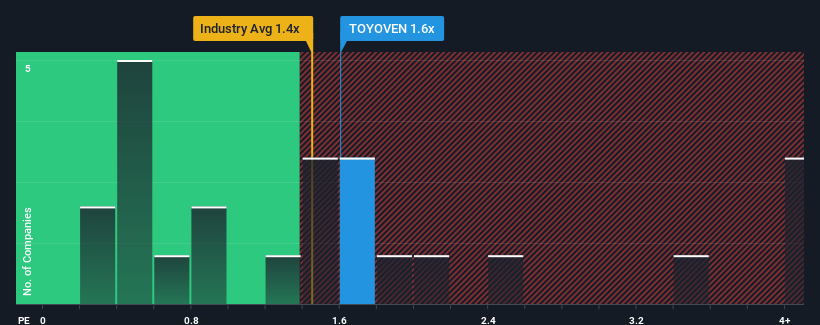
Even after such a large drop in price, it's still not a stretch to say that Toyo Ventures Holdings Berhad's price-to-sales (or "P/S") ratio of 1.6x right now seems quite "middle-of-the-road" compared to the Chemicals industry in Malaysia, where the median P/S ratio is around 1.4x. While this might not raise any eyebrows, if the P/S ratio is not justified investors could be missing out on a potential opportunity or ignoring looming disappointment.
View our latest analysis for Toyo Ventures Holdings Berhad
How Toyo Ventures Holdings Berhad Has Been Performing
For instance, Toyo Ventures Holdings Berhad's receding revenue in recent times would have to be some food for thought. Perhaps investors believe the recent revenue performance is enough to keep in line with the industry, which is keeping the P/S from dropping off. If you like the company, you'd at least be hoping this is the case so that you could potentially pick up some stock while it's not quite in favour.
We don't have analyst forecasts, but you can see how recent trends are setting up the company for the future by checking out our free report on Toyo Ventures Holdings Berhad's earnings, revenue and cash flow.Do Revenue Forecasts Match The P/S Ratio?
In order to justify its P/S ratio, Toyo Ventures Holdings Berhad would need to produce growth that's similar to the industry.
Retrospectively, the last year delivered a frustrating 14% decrease to the company's top line. This has soured the latest three-year period, which nevertheless managed to deliver a decent 9.9% overall rise in revenue. So we can start by confirming that the company has generally done a good job of growing revenue over that time, even though it had some hiccups along the way.
Comparing that to the industry, which is predicted to deliver 4.2% growth in the next 12 months, the company's momentum is pretty similar based on recent medium-term annualised revenue results.
In light of this, it's understandable that Toyo Ventures Holdings Berhad's P/S sits in line with the majority of other companies. It seems most investors are expecting to see average growth rates continue into the future and are only willing to pay a moderate amount for the stock.
The Bottom Line On Toyo Ventures Holdings Berhad's P/S
Toyo Ventures Holdings Berhad's plummeting stock price has brought its P/S back to a similar region as the rest of the industry. It's argued the price-to-sales ratio is an inferior measure of value within certain industries, but it can be a powerful business sentiment indicator.
As we've seen, Toyo Ventures Holdings Berhad's three-year revenue trends seem to be contributing to its P/S, given they look similar to current industry expectations. With previous revenue trends that keep up with the current industry outlook, it's hard to justify the company's P/S ratio deviating much from it's current point. Unless the recent medium-term conditions change, they will continue to support the share price at these levels.
Plus, you should also learn about these 3 warning signs we've spotted with Toyo Ventures Holdings Berhad (including 1 which makes us a bit uncomfortable).
Of course, profitable companies with a history of great earnings growth are generally safer bets. So you may wish to see this free collection of other companies that have reasonable P/E ratios and have grown earnings strongly.
Valuation is complex, but we're here to simplify it.
Discover if Toyo Ventures Holdings Berhad might be undervalued or overvalued with our detailed analysis, featuring fair value estimates, potential risks, dividends, insider trades, and its financial condition.
Access Free AnalysisHave feedback on this article? Concerned about the content? Get in touch with us directly. Alternatively, email editorial-team (at) simplywallst.com.
This article by Simply Wall St is general in nature. We provide commentary based on historical data and analyst forecasts only using an unbiased methodology and our articles are not intended to be financial advice. It does not constitute a recommendation to buy or sell any stock, and does not take account of your objectives, or your financial situation. We aim to bring you long-term focused analysis driven by fundamental data. Note that our analysis may not factor in the latest price-sensitive company announcements or qualitative material. Simply Wall St has no position in any stocks mentioned.
About KLSE:TOYOVEN
Toyo Ventures Holdings Berhad
An investment holding company, primarily engages in the manufacture and sale of printing inks and masterbatches in Malaysia.
Good value with adequate balance sheet.
Market Insights

Advertisement
Community Narratives
The company that turned a verb into a global necessity and basically runs the modern internet, digital ads, smartphones, maps, and AI.
Fair Value US$300.00|10.8% undervalued
OS
Community Contributor
Flowers Foods Pays A Fair Price For Health
Fair Value US$16.12|22.0% undervalued
NV
Community Contributor
TMX Group will thrive with 33.3% profit margin and enduring market moat
Fair Value CA$49.90|3.8% overvalued
LI
Community Contributor