Here’s What’s Happening With Returns At Tek Seng Holdings Berhad (KLSE:TEKSENG)

If you're not sure where to start when looking for the next multi-bagger, there are a few key trends you should keep an eye out for. One common approach is to try and find a company with returns on capital employed (ROCE) that are increasing, in conjunction with a growing amount of capital employed. Basically this means that a company has profitable initiatives that it can continue to reinvest in, which is a trait of a compounding machine. Speaking of which, we noticed some great changes in Tek Seng Holdings Berhad's (KLSE:TEKSENG) returns on capital, so let's have a look.
What is Return On Capital Employed (ROCE)?
Just to clarify if you're unsure, ROCE is a metric for evaluating how much pre-tax income (in percentage terms) a company earns on the capital invested in its business. To calculate this metric for Tek Seng Holdings Berhad, this is the formula:
Return on Capital Employed = Earnings Before Interest and Tax (EBIT) ÷ (Total Assets - Current Liabilities)
0.15 = RM42m ÷ (RM298m - RM25m) (Based on the trailing twelve months to September 2020).
Therefore, Tek Seng Holdings Berhad has an ROCE of 15%. On its own, that's a standard return, however it's much better than the 6.5% generated by the Chemicals industry.
See our latest analysis for Tek Seng Holdings Berhad
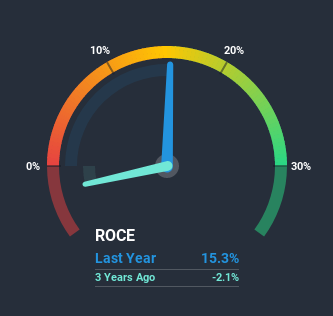
Historical performance is a great place to start when researching a stock so above you can see the gauge for Tek Seng Holdings Berhad's ROCE against it's prior returns. If you're interested in investigating Tek Seng Holdings Berhad's past further, check out this free graph of past earnings, revenue and cash flow.
How Are Returns Trending?
Tek Seng Holdings Berhad is showing promise given that its ROCE is trending up and to the right. Looking at the data, we can see that even though capital employed in the business has remained relatively flat, the ROCE generated has risen by 66% over the last five years. Basically the business is generating higher returns from the same amount of capital and that is proof that there are improvements in the company's efficiencies. On that front, things are looking good so it's worth exploring what management has said about growth plans going forward.
On a related note, the company's ratio of current liabilities to total assets has decreased to 8.5%, which basically reduces it's funding from the likes of short-term creditors or suppliers. This tells us that Tek Seng Holdings Berhad has grown its returns without a reliance on increasing their current liabilities, which we're very happy with.
The Bottom Line On Tek Seng Holdings Berhad's ROCE
In summary, we're delighted to see that Tek Seng Holdings Berhad has been able to increase efficiencies and earn higher rates of return on the same amount of capital. And since the stock has fallen 36% over the last five years, there might be an opportunity here. With that in mind, we believe the promising trends warrant this stock for further investigation.
Tek Seng Holdings Berhad does have some risks, we noticed 5 warning signs (and 1 which doesn't sit too well with us) we think you should know about.
If you want to search for solid companies with great earnings, check out this free list of companies with good balance sheets and impressive returns on equity.
If you’re looking to trade Tek Seng Holdings Berhad, open an account with the lowest-cost* platform trusted by professionals, Interactive Brokers. Their clients from over 200 countries and territories trade stocks, options, futures, forex, bonds and funds worldwide from a single integrated account. Promoted
The New Payments ETF Is Live on NASDAQ:
Money is moving to real-time rails, and a newly listed ETF now gives investors direct exposure. Fast settlement. Institutional custody. Simple access.
Explore how this launch could reshape portfolios
Sponsored ContentValuation is complex, but we're here to simplify it.
Discover if Tek Seng Holdings Berhad might be undervalued or overvalued with our detailed analysis, featuring fair value estimates, potential risks, dividends, insider trades, and its financial condition.
Access Free AnalysisThis article by Simply Wall St is general in nature. It does not constitute a recommendation to buy or sell any stock, and does not take account of your objectives, or your financial situation. We aim to bring you long-term focused analysis driven by fundamental data. Note that our analysis may not factor in the latest price-sensitive company announcements or qualitative material. Simply Wall St has no position in any stocks mentioned.
*Interactive Brokers Rated Lowest Cost Broker by StockBrokers.com Annual Online Review 2020
Have feedback on this article? Concerned about the content? Get in touch with us directly. Alternatively, email editorial-team (at) simplywallst.com.
About KLSE:TEKSENG
Tek Seng Holdings Berhad
An investment holding company, manufactures and trades in polyvinyl chloride (PVC) related products and polypropylene (PP) non-woven products.
Flawless balance sheet established dividend payer.
Market Insights

Weekly Picks

Early mover in a fast growing industry. Likely to experience share price volatility as they scale


A case for CA$31.80 (undiluted), aka 8,616% upside from CA$0.37 (an 86 bagger!).


Moderation and Stabilisation: HOLD: Fair Price based on a 4-year Cycle is $12.08
Recently Updated Narratives

Automotive Electronics Manufacturer Consistent and Stable

Airbnb Stock: Platform Growth in a World of Saturation and Scrutiny

Adobe Stock: AI-Fueled ARR Growth Pushes Guidance Higher, But Cost Pressures Loom
Popular Narratives


Crazy Undervalued 42 Baggers Silver Play (Active & Running Mine)


NVDA: Expanding AI Demand Will Drive Major Data Center Investments Through 2026

The AI Infrastructure Giant Grows Into Its Valuation
Trending Discussion


