Calculating The Intrinsic Value Of Ta Ann Holdings Berhad (KLSE:TAANN)

Today we'll do a simple run through of a valuation method used to estimate the attractiveness of Ta Ann Holdings Berhad (KLSE:TAANN) as an investment opportunity by taking the expected future cash flows and discounting them to their present value. We will take advantage of the Discounted Cash Flow (DCF) model for this purpose. Believe it or not, it's not too difficult to follow, as you'll see from our example!
We generally believe that a company's value is the present value of all of the cash it will generate in the future. However, a DCF is just one valuation metric among many, and it is not without flaws. For those who are keen learners of equity analysis, the Simply Wall St analysis model here may be something of interest to you.
View our latest analysis for Ta Ann Holdings Berhad
The model
We are going to use a two-stage DCF model, which, as the name states, takes into account two stages of growth. The first stage is generally a higher growth period which levels off heading towards the terminal value, captured in the second 'steady growth' period. In the first stage we need to estimate the cash flows to the business over the next ten years. Where possible we use analyst estimates, but when these aren't available we extrapolate the previous free cash flow (FCF) from the last estimate or reported value. We assume companies with shrinking free cash flow will slow their rate of shrinkage, and that companies with growing free cash flow will see their growth rate slow, over this period. We do this to reflect that growth tends to slow more in the early years than it does in later years.
Generally we assume that a dollar today is more valuable than a dollar in the future, so we need to discount the sum of these future cash flows to arrive at a present value estimate:
10-year free cash flow (FCF) estimate
| 2021 | 2022 | 2023 | 2024 | 2025 | 2026 | 2027 | 2028 | 2029 | 2030 | |
| Levered FCF (MYR, Millions) | RM208.4m | RM155.7m | RM200.9m | RM191.4m | RM187.2m | RM186.3m | RM187.8m | RM190.8m | RM195.1m | RM200.2m |
| Growth Rate Estimate Source | Analyst x2 | Analyst x3 | Analyst x2 | Est @ -4.7% | Est @ -2.2% | Est @ -0.46% | Est @ 0.77% | Est @ 1.62% | Est @ 2.22% | Est @ 2.64% |
| Present Value (MYR, Millions) Discounted @ 14% | RM182 | RM119 | RM134 | RM112 | RM95.6 | RM83.2 | RM73.3 | RM65.1 | RM58.2 | RM52.2 |
("Est" = FCF growth rate estimated by Simply Wall St)
Present Value of 10-year Cash Flow (PVCF) = RM974m
The second stage is also known as Terminal Value, this is the business's cash flow after the first stage. For a number of reasons a very conservative growth rate is used that cannot exceed that of a country's GDP growth. In this case we have used the 5-year average of the 10-year government bond yield (3.6%) to estimate future growth. In the same way as with the 10-year 'growth' period, we discount future cash flows to today's value, using a cost of equity of 14%.
Terminal Value (TV)= FCF2030 × (1 + g) ÷ (r – g) = RM200m× (1 + 3.6%) ÷ (14%– 3.6%) = RM1.9b
Present Value of Terminal Value (PVTV)= TV / (1 + r)10= RM1.9b÷ ( 1 + 14%)10= RM502m
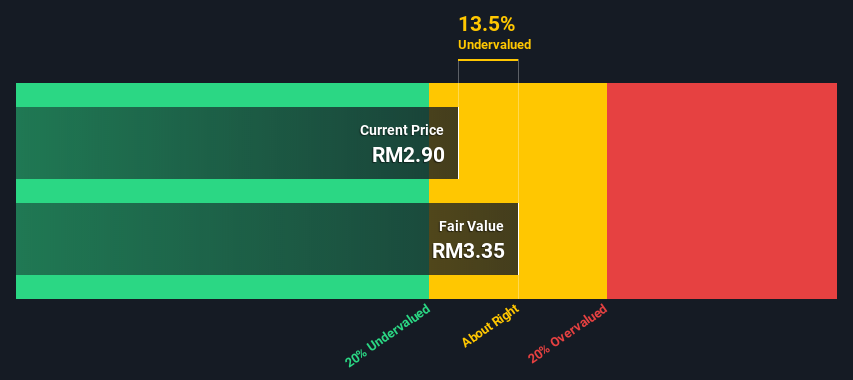
The total value, or equity value, is then the sum of the present value of the future cash flows, which in this case is RM1.5b. In the final step we divide the equity value by the number of shares outstanding. Relative to the current share price of RM2.9, the company appears about fair value at a 13% discount to where the stock price trades currently. Remember though, that this is just an approximate valuation, and like any complex formula - garbage in, garbage out.
The assumptions
We would point out that the most important inputs to a discounted cash flow are the discount rate and of course the actual cash flows. You don't have to agree with these inputs, I recommend redoing the calculations yourself and playing with them. The DCF also does not consider the possible cyclicality of an industry, or a company's future capital requirements, so it does not give a full picture of a company's potential performance. Given that we are looking at Ta Ann Holdings Berhad as potential shareholders, the cost of equity is used as the discount rate, rather than the cost of capital (or weighted average cost of capital, WACC) which accounts for debt. In this calculation we've used 14%, which is based on a levered beta of 1.831. Beta is a measure of a stock's volatility, compared to the market as a whole. We get our beta from the industry average beta of globally comparable companies, with an imposed limit between 0.8 and 2.0, which is a reasonable range for a stable business.
Next Steps:
Valuation is only one side of the coin in terms of building your investment thesis, and it shouldn't be the only metric you look at when researching a company. DCF models are not the be-all and end-all of investment valuation. Rather it should be seen as a guide to "what assumptions need to be true for this stock to be under/overvalued?" For instance, if the terminal value growth rate is adjusted slightly, it can dramatically alter the overall result. For Ta Ann Holdings Berhad, we've compiled three additional aspects you should assess:
- Risks: Consider for instance, the ever-present spectre of investment risk. We've identified 1 warning sign with Ta Ann Holdings Berhad , and understanding this should be part of your investment process.
- Future Earnings: How does TAANN's growth rate compare to its peers and the wider market? Dig deeper into the analyst consensus number for the upcoming years by interacting with our free analyst growth expectation chart.
- Other High Quality Alternatives: Do you like a good all-rounder? Explore our interactive list of high quality stocks to get an idea of what else is out there you may be missing!
PS. Simply Wall St updates its DCF calculation for every Malaysian stock every day, so if you want to find the intrinsic value of any other stock just search here.
If you’re looking to trade a wide range of investments, open an account with the lowest-cost* platform trusted by professionals, Interactive Brokers. Their clients from over 200 countries and territories trade stocks, options, futures, forex, bonds and funds worldwide from a single integrated account. Promoted
Mobile Infrastructure for Defense and Disaster
The next wave in robotics isn't humanoid. Its fully autonomous towers delivering 5G, ISR, and radar in under 30 minutes, anywhere.
Get the investor briefing before the next round of contracts
Sponsored On Behalf of CiTechValuation is complex, but we're here to simplify it.
Discover if Ta Ann Holdings Berhad might be undervalued or overvalued with our detailed analysis, featuring fair value estimates, potential risks, dividends, insider trades, and its financial condition.
Access Free AnalysisThis article by Simply Wall St is general in nature. It does not constitute a recommendation to buy or sell any stock, and does not take account of your objectives, or your financial situation. We aim to bring you long-term focused analysis driven by fundamental data. Note that our analysis may not factor in the latest price-sensitive company announcements or qualitative material. Simply Wall St has no position in any stocks mentioned.
*Interactive Brokers Rated Lowest Cost Broker by StockBrokers.com Annual Online Review 2020
Have feedback on this article? Concerned about the content? Get in touch with us directly. Alternatively, email editorial-team (at) simplywallst.com.
About KLSE:TAANN
Ta Ann Holdings Berhad
An investment holding company, operates as a timber and oil palm plantation company.
Flawless balance sheet established dividend payer.
Similar Companies
Market Insights

Weekly Picks

Early mover in a fast growing industry. Likely to experience share price volatility as they scale


A case for CA$31.80 (undiluted), aka 8,616% upside from CA$0.37 (an 86 bagger!).


Moderation and Stabilisation: HOLD: Fair Price based on a 4-year Cycle is $12.08
Recently Updated Narratives

Airbnb Stock: Platform Growth in a World of Saturation and Scrutiny

Adobe Stock: AI-Fueled ARR Growth Pushes Guidance Higher, But Cost Pressures Loom

Thomson Reuters Stock: When Legal Intelligence Becomes Mission-Critical Infrastructure
Popular Narratives


Crazy Undervalued 42 Baggers Silver Play (Active & Running Mine)


NVDA: Expanding AI Demand Will Drive Major Data Center Investments Through 2026

The AI Infrastructure Giant Grows Into Its Valuation
Trending Discussion


