
Advertisement
- Malaysia
- /
- Metals and Mining
- /
- KLSE:PMBTECH
We're Watching These Trends At PMB Technology Berhad (KLSE:PMBTECH)

Did you know there are some financial metrics that can provide clues of a potential multi-bagger? Typically, we'll want to notice a trend of growing return on capital employed (ROCE) and alongside that, an expanding base of capital employed. Ultimately, this demonstrates that it's a business that is reinvesting profits at increasing rates of return. Having said that, from a first glance at PMB Technology Berhad (KLSE:PMBTECH) we aren't jumping out of our chairs at how returns are trending, but let's have a deeper look.
What is Return On Capital Employed (ROCE)?
For those who don't know, ROCE is a measure of a company's yearly pre-tax profit (its return), relative to the capital employed in the business. The formula for this calculation on PMB Technology Berhad is:
Return on Capital Employed = Earnings Before Interest and Tax (EBIT) ÷ (Total Assets - Current Liabilities)
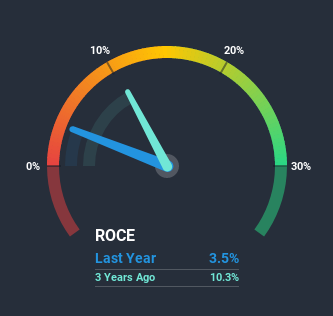
0.035 = RM30m ÷ (RM1.1b - RM223m) (Based on the trailing twelve months to September 2020).
Therefore, PMB Technology Berhad has an ROCE of 3.5%. On its own, that's a low figure but it's around the 3.2% average generated by the Metals and Mining industry.
Check out our latest analysis for PMB Technology Berhad
While the past is not representative of the future, it can be helpful to know how a company has performed historically, which is why we have this chart above. If you're interested in investigating PMB Technology Berhad's past further, check out this free graph of past earnings, revenue and cash flow.
So How Is PMB Technology Berhad's ROCE Trending?
In terms of PMB Technology Berhad's historical ROCE movements, the trend isn't fantastic. Over the last five years, returns on capital have decreased to 3.5% from 10% five years ago. However, given capital employed and revenue have both increased it appears that the business is currently pursuing growth, at the consequence of short term returns. If these investments prove successful, this can bode very well for long term stock performance.
On a side note, PMB Technology Berhad has done well to pay down its current liabilities to 21% of total assets. So we could link some of this to the decrease in ROCE. Effectively this means their suppliers or short-term creditors are funding less of the business, which reduces some elements of risk. Some would claim this reduces the business' efficiency at generating ROCE since it is now funding more of the operations with its own money.
What We Can Learn From PMB Technology Berhad's ROCE
In summary, despite lower returns in the short term, we're encouraged to see that PMB Technology Berhad is reinvesting for growth and has higher sales as a result. And long term investors must be optimistic going forward because the stock has returned a huge 1,121% to shareholders in the last five years. So should these growth trends continue, we'd be optimistic on the stock going forward.
One more thing to note, we've identified 2 warning signs with PMB Technology Berhad and understanding them should be part of your investment process.
While PMB Technology Berhad may not currently earn the highest returns, we've compiled a list of companies that currently earn more than 25% return on equity. Check out this free list here.
If you decide to trade PMB Technology Berhad, use the lowest-cost* platform that is rated #1 Overall by Barron’s, Interactive Brokers. Trade stocks, options, futures, forex, bonds and funds on 135 markets, all from a single integrated account. Promoted
New: Manage All Your Stock Portfolios in One Place
We've created the ultimate portfolio companion for stock investors, and it's free.
• Connect an unlimited number of Portfolios and see your total in one currency
• Be alerted to new Warning Signs or Risks via email or mobile
• Track the Fair Value of your stocks
This article by Simply Wall St is general in nature. It does not constitute a recommendation to buy or sell any stock, and does not take account of your objectives, or your financial situation. We aim to bring you long-term focused analysis driven by fundamental data. Note that our analysis may not factor in the latest price-sensitive company announcements or qualitative material. Simply Wall St has no position in any stocks mentioned.
*Interactive Brokers Rated Lowest Cost Broker by StockBrokers.com Annual Online Review 2020
Have feedback on this article? Concerned about the content? Get in touch with us directly. Alternatively, email editorial-team (at) simplywallst.com.
About KLSE:PMBTECH
PMB Technology Berhad
An investment holding company, produces and distributes metallic silicon and aluminium related products in Malaysia, other Asian countries, and internationally.
Solid track record with adequate balance sheet.
Market Insights


Advertisement
Community Narratives
A Quality Compounder Marked Down on Overblown Fears
Fair Value US$120.72|62.4% undervalued
BA
Community Contributor

Wyndham Continues Global Expansion with 19% Ancillary Revenue Growth
Fair Value US$105.80|19.2% undervalued
ZW
Community Contributor