
GPHAROS Stock Overview
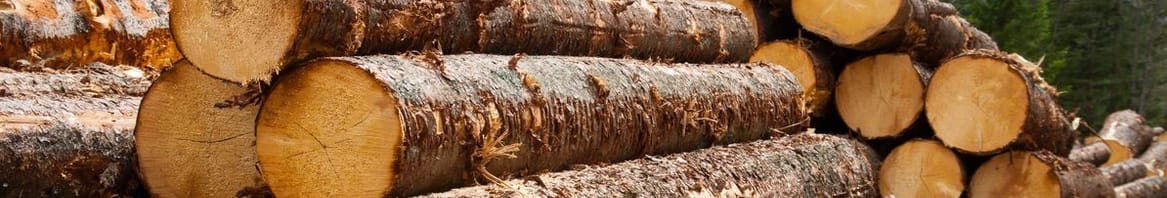
An investment holding company, primarily engages in the forest concession management, harvesting, distribution, sawmilling, and processing of wood-based products in Malaysia and internationally. More details
| Snowflake Score | |
|---|---|
| Valuation | 2/6 |
| Future Growth | 0/6 |
| Past Performance | 0/6 |
| Financial Health | 4/6 |
| Dividends | 0/6 |
Community vs My Fair Value
Create NarrativeSelect a narrative for quick price alerts from the community, or create your own.
Golden Pharos Berhad Competitors
Price History & Performance
| Historical stock prices | |
|---|---|
| Current Share Price | RM 0.20 |
| 52 Week High | RM 0.56 |
| 52 Week Low | RM 0.16 |
| Beta | 0.79 |
| 1 Month Change | 5.26% |
| 3 Month Change | -38.46% |
| 1 Year Change | -56.52% |
| 3 Year Change | -41.18% |
| 5 Year Change | 17.65% |
| Change since IPO | -97.14% |
Recent News & Updates
Recent updates
Golden Pharos Berhad's (KLSE:GPHAROS) 35% Share Price Plunge Could Signal Some Risk
Mar 05Shareholders Can Be Confident That Golden Pharos Berhad's (KLSE:GPHAROS) Earnings Are High Quality
Aug 27Golden Pharos Berhad (KLSE:GPHAROS) Looks Inexpensive But Perhaps Not Attractive Enough
Aug 05A Look At The Intrinsic Value Of Golden Pharos Berhad (KLSE:GPHAROS)
May 22Golden Pharos Berhad (KLSE:GPHAROS) Seems To Use Debt Rather Sparingly
Apr 17Golden Pharos Berhad (KLSE:GPHAROS) Held Back By Insufficient Growth Even After Shares Climb 83%
Mar 13There's Been No Shortage Of Growth Recently For Golden Pharos Berhad's (KLSE:GPHAROS) Returns On Capital
Feb 29The Market Doesn't Like What It Sees From Golden Pharos Berhad's (KLSE:GPHAROS) Earnings Yet
Jan 17Here's Why Golden Pharos Berhad (KLSE:GPHAROS) Can Manage Its Debt Responsibly
Nov 09Golden Pharos Berhad's (KLSE:GPHAROS) Shares Not Telling The Full Story
Aug 16Golden Pharos Berhad (KLSE:GPHAROS) Has A Rock Solid Balance Sheet
May 04Golden Pharos Berhad (KLSE:GPHAROS) Might Have The Makings Of A Multi-Bagger
Mar 03There's Been No Shortage Of Growth Recently For Golden Pharos Berhad's (KLSE:GPHAROS) Returns On Capital
Oct 06Does Golden Pharos Berhad (KLSE:GPHAROS) Have A Healthy Balance Sheet?
Jul 01These 4 Measures Indicate That Golden Pharos Berhad (KLSE:GPHAROS) Is Using Debt Reasonably Well
Feb 28Does Golden Pharos Berhad (KLSE:GPHAROS) Have A Healthy Balance Sheet?
Nov 11Is Golden Pharos Berhad (KLSE:GPHAROS) Using Too Much Debt?
Jul 25Is Golden Pharos Berhad (KLSE:GPHAROS) Using Too Much Debt?
Apr 11Is Golden Pharos Berhad (KLSE:GPHAROS) Using Debt Sensibly?
Dec 27Shareholder Returns
| GPHAROS | MY Forestry | MY Market | |
|---|---|---|---|
| 7D | 2.6% | -1.0% | 0.8% |
| 1Y | -56.5% | -16.7% | -6.9% |
Return vs Industry: GPHAROS underperformed the MY Forestry industry which returned -16.7% over the past year.
Return vs Market: GPHAROS underperformed the MY Market which returned -6.9% over the past year.
Price Volatility
| GPHAROS volatility | |
|---|---|
| GPHAROS Average Weekly Movement | 9.1% |
| Forestry Industry Average Movement | 6.2% |
| Market Average Movement | 6.6% |
| 10% most volatile stocks in MY Market | 12.6% |
| 10% least volatile stocks in MY Market | 3.4% |
Stable Share Price: GPHAROS's share price has been volatile over the past 3 months compared to the MY market.
Volatility Over Time: GPHAROS's weekly volatility (9%) has been stable over the past year, but is still higher than 75% of MY stocks.
About the Company
| Founded | Employees | CEO | Website |
|---|---|---|---|
| 1986 | 295 | Mohd Bin Mamat | www.goldenpharos.com.my |
Golden Pharos Berhad, an investment holding company, primarily engages in the forest concession management, harvesting, distribution, sawmilling, and processing of wood-based products in Malaysia and internationally. It operates through three segments: Harvesting, Forest Plantation, Sawmilling, Sales of Logs and Logging Compartments; Manufacturing; and Others. The company is involved in the manufacture and trade of glasses, veneer, and woodchips; moulding and producing finger joint and furniture, and kiln drying; and harvesting and sustainable forest management businesses.
Golden Pharos Berhad Fundamentals Summary
| GPHAROS fundamental statistics | |
|---|---|
| Market cap | RM 28.16m |
| Earnings (TTM) | -RM 14.30m |
| Revenue (TTM) | RM 47.05m |
0.6x
P/S Ratio-2.0x
P/E RatioIs GPHAROS overvalued?
See Fair Value and valuation analysisEarnings & Revenue
| GPHAROS income statement (TTM) | |
|---|---|
| Revenue | RM 47.05m |
| Cost of Revenue | RM 44.96m |
| Gross Profit | RM 2.09m |
| Other Expenses | RM 16.38m |
| Earnings | -RM 14.30m |
Last Reported Earnings
Dec 31, 2024
Next Earnings Date
n/a
| Earnings per share (EPS) | -0.10 |
| Gross Margin | 4.44% |
| Net Profit Margin | -30.39% |
| Debt/Equity Ratio | 8.6% |
How did GPHAROS perform over the long term?
See historical performance and comparisonCompany Analysis and Financial Data Status
| Data | Last Updated (UTC time) |
|---|---|
| Company Analysis | 2025/05/09 02:36 |
| End of Day Share Price | 2025/05/09 00:00 |
| Earnings | 2024/12/31 |
| Annual Earnings | 2024/12/31 |
Data Sources
The data used in our company analysis is from S&P Global Market Intelligence LLC. The following data is used in our analysis model to generate this report. Data is normalised which can introduce a delay from the source being available.
| Package | Data | Timeframe | Example US Source * |
|---|---|---|---|
| Company Financials | 10 years |
| |
| Analyst Consensus Estimates | +3 years |
|
|
| Market Prices | 30 years |
| |
| Ownership | 10 years |
| |
| Management | 10 years |
| |
| Key Developments | 10 years |
|
* Example for US securities, for non-US equivalent regulatory forms and sources are used.
Unless specified all financial data is based on a yearly period but updated quarterly. This is known as Trailing Twelve Month (TTM) or Last Twelve Month (LTM) Data. Learn more.
Analysis Model and Snowflake
Details of the analysis model used to generate this report is available on our Github page, we also have guides on how to use our reports and tutorials on Youtube.
Learn about the world class team who designed and built the Simply Wall St analysis model.
Industry and Sector Metrics
Our industry and section metrics are calculated every 6 hours by Simply Wall St, details of our process are available on Github.
Analyst Sources
Golden Pharos Berhad is covered by 0 analysts. 0 of those analysts submitted the estimates of revenue or earnings used as inputs to our report. Analysts submissions are updated throughout the day.