
Advertisement
- Malaysia
- /
- Metals and Mining
- /
- KLSE:AUMAS
AuMas Resources Berhad (KLSE:AUMAS) sheds 11% this week, as yearly returns fall more in line with earnings growth
AuMas Resources Berhad (KLSE:AUMAS) shareholders might be concerned after seeing the share price drop 11% in the last week. But in three years the returns have been great. In fact, the share price is up a full 152% compared to three years ago. So the recent fall in the share price should be viewed in that context. The fundamental business performance will ultimately dictate whether the top is in, or if this is a stellar buying opportunity.
While the stock has fallen 11% this week, it's worth focusing on the longer term and seeing if the stocks historical returns have been driven by the underlying fundamentals.
While markets are a powerful pricing mechanism, share prices reflect investor sentiment, not just underlying business performance. One imperfect but simple way to consider how the market perception of a company has shifted is to compare the change in the earnings per share (EPS) with the share price movement.
AuMas Resources Berhad was able to grow its EPS at 2.6% per year over three years, sending the share price higher. This EPS growth is lower than the 36% average annual increase in the share price. This indicates that the market is feeling more optimistic on the stock, after the last few years of progress. It's not unusual to see the market 're-rate' a stock, after a few years of growth. This favorable sentiment is reflected in its (fairly optimistic) P/E ratio of 70.55.
The image below shows how EPS has tracked over time (if you click on the image you can see greater detail).
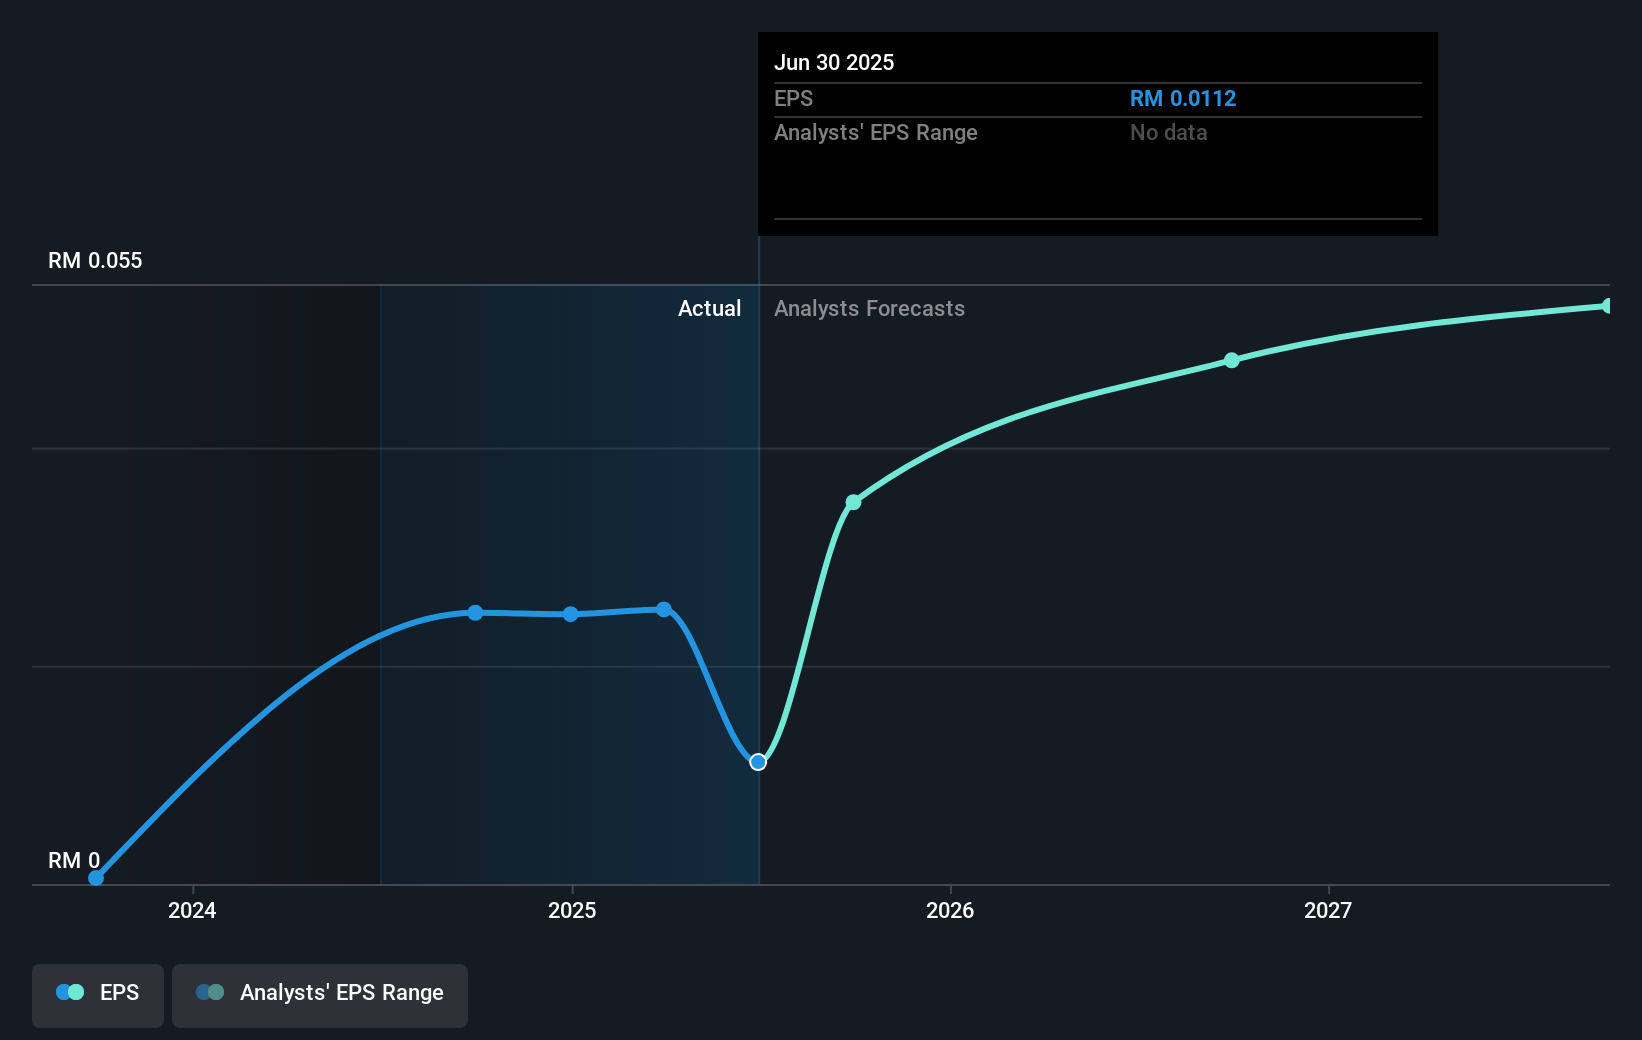
It might be well worthwhile taking a look at our free report on AuMas Resources Berhad's earnings, revenue and cash flow.
What About Dividends?
When looking at investment returns, it is important to consider the difference between total shareholder return (TSR) and share price return. The TSR is a return calculation that accounts for the value of cash dividends (assuming that any dividend received was reinvested) and the calculated value of any discounted capital raisings and spin-offs. Arguably, the TSR gives a more comprehensive picture of the return generated by a stock. We note that for AuMas Resources Berhad the TSR over the last 3 years was 160%, which is better than the share price return mentioned above. This is largely a result of its dividend payments!
A Different Perspective
AuMas Resources Berhad shareholders are down 4.8% for the year (even including dividends), but the market itself is up 3.4%. However, keep in mind that even the best stocks will sometimes underperform the market over a twelve month period. On the bright side, long term shareholders have made money, with a gain of 11% per year over half a decade. If the fundamental data continues to indicate long term sustainable growth, the current sell-off could be an opportunity worth considering. It's always interesting to track share price performance over the longer term. But to understand AuMas Resources Berhad better, we need to consider many other factors. Even so, be aware that AuMas Resources Berhad is showing 3 warning signs in our investment analysis , and 2 of those are a bit concerning...
If you would prefer to check out another company -- one with potentially superior financials -- then do not miss this free list of companies that have proven they can grow earnings.
Please note, the market returns quoted in this article reflect the market weighted average returns of stocks that currently trade on Malaysian exchanges.
New: Manage All Your Stock Portfolios in One Place
We've created the ultimate portfolio companion for stock investors, and it's free.
• Connect an unlimited number of Portfolios and see your total in one currency
• Be alerted to new Warning Signs or Risks via email or mobile
• Track the Fair Value of your stocks
Have feedback on this article? Concerned about the content? Get in touch with us directly. Alternatively, email editorial-team (at) simplywallst.com.
This article by Simply Wall St is general in nature. We provide commentary based on historical data and analyst forecasts only using an unbiased methodology and our articles are not intended to be financial advice. It does not constitute a recommendation to buy or sell any stock, and does not take account of your objectives, or your financial situation. We aim to bring you long-term focused analysis driven by fundamental data. Note that our analysis may not factor in the latest price-sensitive company announcements or qualitative material. Simply Wall St has no position in any stocks mentioned.
About KLSE:AUMAS
AuMas Resources Berhad
An investment holding company, engages in gold mining business in Malaysia.
Flawless balance sheet with reasonable growth potential.
Market Insights

Advertisement
Community Narratives
Finding The True Value Of A Logistics Powerhouse
Fair Value US$95.21|6.3% undervalued
NV
Community Contributor
Paradigm Biopharmaceuticals Will Lead Osteoarthritis Treatment with Zilosul's FDA Success
Fair Value AU$5.50|91.9% undervalued
AM
Community Contributor
Barrick Mining (ABX:CA): A Gold Hedge against a U.S. Shutdown
Fair Value CA$60.00|25.8% undervalued
GM
Community Contributor