
Advertisement
Getting In Cheap On Asia Poly Holdings Berhad (KLSE:ASIAPLY) Is Unlikely
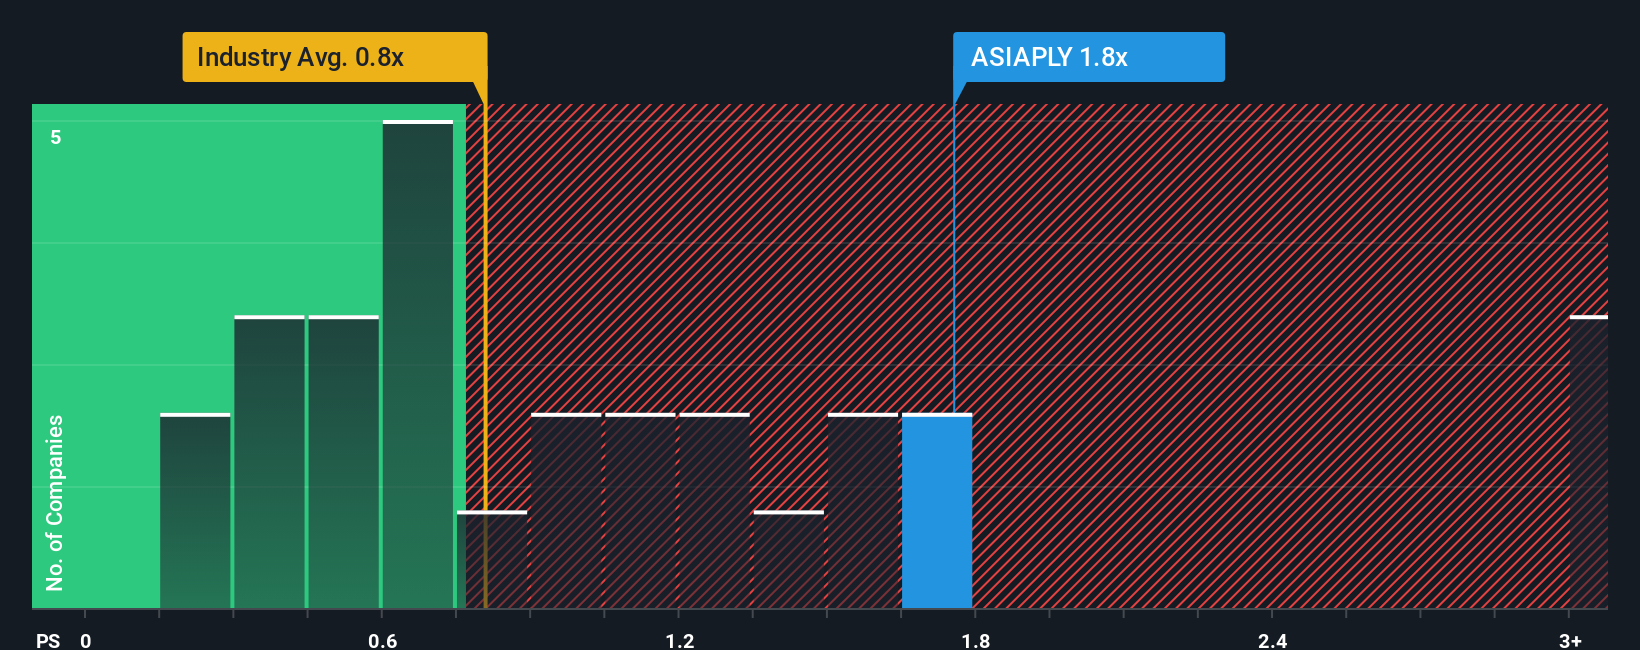
Asia Poly Holdings Berhad's (KLSE:ASIAPLY) price-to-sales (or "P/S") ratio of 1.8x may not look like an appealing investment opportunity when you consider close to half the companies in the Chemicals industry in Malaysia have P/S ratios below 0.8x. Although, it's not wise to just take the P/S at face value as there may be an explanation why it's as high as it is.
Check out our latest analysis for Asia Poly Holdings Berhad
What Does Asia Poly Holdings Berhad's P/S Mean For Shareholders?
As an illustration, revenue has deteriorated at Asia Poly Holdings Berhad over the last year, which is not ideal at all. One possibility is that the P/S is high because investors think the company will still do enough to outperform the broader industry in the near future. If not, then existing shareholders may be quite nervous about the viability of the share price.
Although there are no analyst estimates available for Asia Poly Holdings Berhad, take a look at this free data-rich visualisation to see how the company stacks up on earnings, revenue and cash flow.How Is Asia Poly Holdings Berhad's Revenue Growth Trending?
Asia Poly Holdings Berhad's P/S ratio would be typical for a company that's expected to deliver solid growth, and importantly, perform better than the industry.
Retrospectively, the last year delivered a frustrating 7.2% decrease to the company's top line. That put a dampener on the good run it was having over the longer-term as its three-year revenue growth is still a noteworthy 24% in total. So we can start by confirming that the company has generally done a good job of growing revenue over that time, even though it had some hiccups along the way.
Comparing that to the industry, which is predicted to deliver 5.8% growth in the next 12 months, the company's momentum is pretty similar based on recent medium-term annualised revenue results.
In light of this, it's curious that Asia Poly Holdings Berhad's P/S sits above the majority of other companies. It seems most investors are ignoring the fairly average recent growth rates and are willing to pay up for exposure to the stock. Nevertheless, they may be setting themselves up for future disappointment if the P/S falls to levels more in line with recent growth rates.
The Bottom Line On Asia Poly Holdings Berhad's P/S
While the price-to-sales ratio shouldn't be the defining factor in whether you buy a stock or not, it's quite a capable barometer of revenue expectations.
We didn't expect to see Asia Poly Holdings Berhad trade at such a high P/S considering its last three-year revenue growth has only been on par with the rest of the industry. When we see average revenue with industry-like growth combined with a high P/S, we suspect the share price is at risk of declining, bringing the P/S back in line with the industry too. If recent medium-term revenue trends continue, it will place shareholders' investments at risk and potential investors in danger of paying an unnecessary premium.
We don't want to rain on the parade too much, but we did also find 2 warning signs for Asia Poly Holdings Berhad (1 makes us a bit uncomfortable!) that you need to be mindful of.
Of course, profitable companies with a history of great earnings growth are generally safer bets. So you may wish to see this free collection of other companies that have reasonable P/E ratios and have grown earnings strongly.
New: Manage All Your Stock Portfolios in One Place
We've created the ultimate portfolio companion for stock investors, and it's free.
• Connect an unlimited number of Portfolios and see your total in one currency
• Be alerted to new Warning Signs or Risks via email or mobile
• Track the Fair Value of your stocks
Have feedback on this article? Concerned about the content? Get in touch with us directly. Alternatively, email editorial-team (at) simplywallst.com.
This article by Simply Wall St is general in nature. We provide commentary based on historical data and analyst forecasts only using an unbiased methodology and our articles are not intended to be financial advice. It does not constitute a recommendation to buy or sell any stock, and does not take account of your objectives, or your financial situation. We aim to bring you long-term focused analysis driven by fundamental data. Note that our analysis may not factor in the latest price-sensitive company announcements or qualitative material. Simply Wall St has no position in any stocks mentioned.
About KLSE:ASIAPLY
Asia Poly Holdings Berhad
An investment holding company, manufactures and sells cell cast acrylic sheets.
Adequate balance sheet with very low risk.
Market Insights

Advertisement
Community Narratives
MINISO's fair value is projected at 26.69 with an anticipated PE ratio shift of 20x
Fair Value US$24.03|11.0% undervalued
BE
Community Contributor
Procter & Gamble: A Dividend Giant Facing Slowing Growth
Fair Value US$119.81|23.3% overvalued
AN
Community Contributor
Eli Lilly's Future Growth Driven by Tirzepatide and Favorable Market Conditions
Fair Value US$1.19k|14.0% undervalued
EA
Community Contributor