- Malaysia
- /
- Metals and Mining
- /
- KLSE:ANNJOO
Did You Participate In Any Of Ann Joo Resources Berhad's (KLSE:ANNJOO) Fantastic 177% Return ?

When you buy shares in a company, it's worth keeping in mind the possibility that it could fail, and you could lose your money. But on a lighter note, a good company can see its share price rise well over 100%. For instance, the price of Ann Joo Resources Berhad (KLSE:ANNJOO) stock is up an impressive 131% over the last five years. It's up an even more impressive 134% over the last quarter.
Check out our latest analysis for Ann Joo Resources Berhad
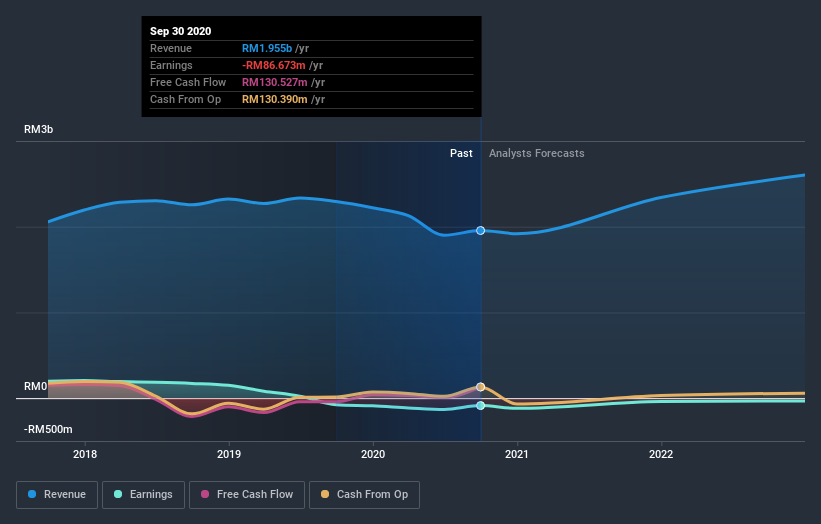
Ann Joo Resources Berhad wasn't profitable in the last twelve months, it is unlikely we'll see a strong correlation between its share price and its earnings per share (EPS). Arguably revenue is our next best option. When a company doesn't make profits, we'd generally expect to see good revenue growth. Some companies are willing to postpone profitability to grow revenue faster, but in that case one does expect good top-line growth.
In the last 5 years Ann Joo Resources Berhad saw its revenue grow at 4.4% per year. That's not a very high growth rate considering the bottom line. So we wouldn't have expected to see the share price to have lifted 18% for each year during that time, but that's what happened. Shareholders should be pretty happy with that, although interested investors might want to examine the financial data more closely to see if the gains are really justified. It may be that the market is pretty optimistic about Ann Joo Resources Berhad.
You can see how earnings and revenue have changed over time in the image below (click on the chart to see the exact values).
We're pleased to report that the CEO is remunerated more modestly than most CEOs at similarly capitalized companies. It's always worth keeping an eye on CEO pay, but a more important question is whether the company will grow earnings throughout the years. You can see what analysts are predicting for Ann Joo Resources Berhad in this interactive graph of future profit estimates.
What about the Total Shareholder Return (TSR)?
We'd be remiss not to mention the difference between Ann Joo Resources Berhad's total shareholder return (TSR) and its share price return. The TSR attempts to capture the value of dividends (as if they were reinvested) as well as any spin-offs or discounted capital raisings offered to shareholders. Its history of dividend payouts mean that Ann Joo Resources Berhad's TSR of 177% over the last 5 years is better than the share price return.
A Different Perspective
It's good to see that Ann Joo Resources Berhad has rewarded shareholders with a total shareholder return of 22% in the last twelve months. However, the TSR over five years, coming in at 23% per year, is even more impressive. I find it very interesting to look at share price over the long term as a proxy for business performance. But to truly gain insight, we need to consider other information, too. Like risks, for instance. Every company has them, and we've spotted 2 warning signs for Ann Joo Resources Berhad (of which 1 shouldn't be ignored!) you should know about.
But note: Ann Joo Resources Berhad may not be the best stock to buy. So take a peek at this free list of interesting companies with past earnings growth (and further growth forecast).
Please note, the market returns quoted in this article reflect the market weighted average returns of stocks that currently trade on MY exchanges.
If you decide to trade Ann Joo Resources Berhad, use the lowest-cost* platform that is rated #1 Overall by Barron’s, Interactive Brokers. Trade stocks, options, futures, forex, bonds and funds on 135 markets, all from a single integrated account. Promoted
Mobile Infrastructure for Defense and Disaster
The next wave in robotics isn't humanoid. Its fully autonomous towers delivering 5G, ISR, and radar in under 30 minutes, anywhere.
Get the investor briefing before the next round of contracts
Sponsored On Behalf of CiTechNew: Manage All Your Stock Portfolios in One Place
We've created the ultimate portfolio companion for stock investors, and it's free.
• Connect an unlimited number of Portfolios and see your total in one currency
• Be alerted to new Warning Signs or Risks via email or mobile
• Track the Fair Value of your stocks
This article by Simply Wall St is general in nature. It does not constitute a recommendation to buy or sell any stock, and does not take account of your objectives, or your financial situation. We aim to bring you long-term focused analysis driven by fundamental data. Note that our analysis may not factor in the latest price-sensitive company announcements or qualitative material. Simply Wall St has no position in any stocks mentioned.
*Interactive Brokers Rated Lowest Cost Broker by StockBrokers.com Annual Online Review 2020
Have feedback on this article? Concerned about the content? Get in touch with us directly. Alternatively, email editorial-team (at) simplywallst.com.
About KLSE:ANNJOO
Ann Joo Resources Berhad
An investment holding company, manufactures and trades in iron, steel, and steel related products in Malaysia and Singapore.
Reasonable growth potential and fair value.
Market Insights

Weekly Picks

Early mover in a fast growing industry. Likely to experience share price volatility as they scale


A case for CA$31.80 (undiluted), aka 8,616% upside from CA$0.37 (an 86 bagger!).


Moderation and Stabilisation: HOLD: Fair Price based on a 4-year Cycle is $12.08
Recently Updated Narratives

Airbnb Stock: Platform Growth in a World of Saturation and Scrutiny

Adobe Stock: AI-Fueled ARR Growth Pushes Guidance Higher, But Cost Pressures Loom

Thomson Reuters Stock: When Legal Intelligence Becomes Mission-Critical Infrastructure
Popular Narratives


Crazy Undervalued 42 Baggers Silver Play (Active & Running Mine)


NVDA: Expanding AI Demand Will Drive Major Data Center Investments Through 2026

The AI Infrastructure Giant Grows Into Its Valuation
Trending Discussion


