
Advertisement
- Malaysia
- /
- Healthcare Services
- /
- KLSE:G3
G3 Global Berhad (KLSE:G3) Stock Rockets 33% But Many Are Still Ignoring The Company
The G3 Global Berhad (KLSE:G3) share price has done very well over the last month, posting an excellent gain of 33%. Not all shareholders will be feeling jubilant, since the share price is still down a very disappointing 43% in the last twelve months.
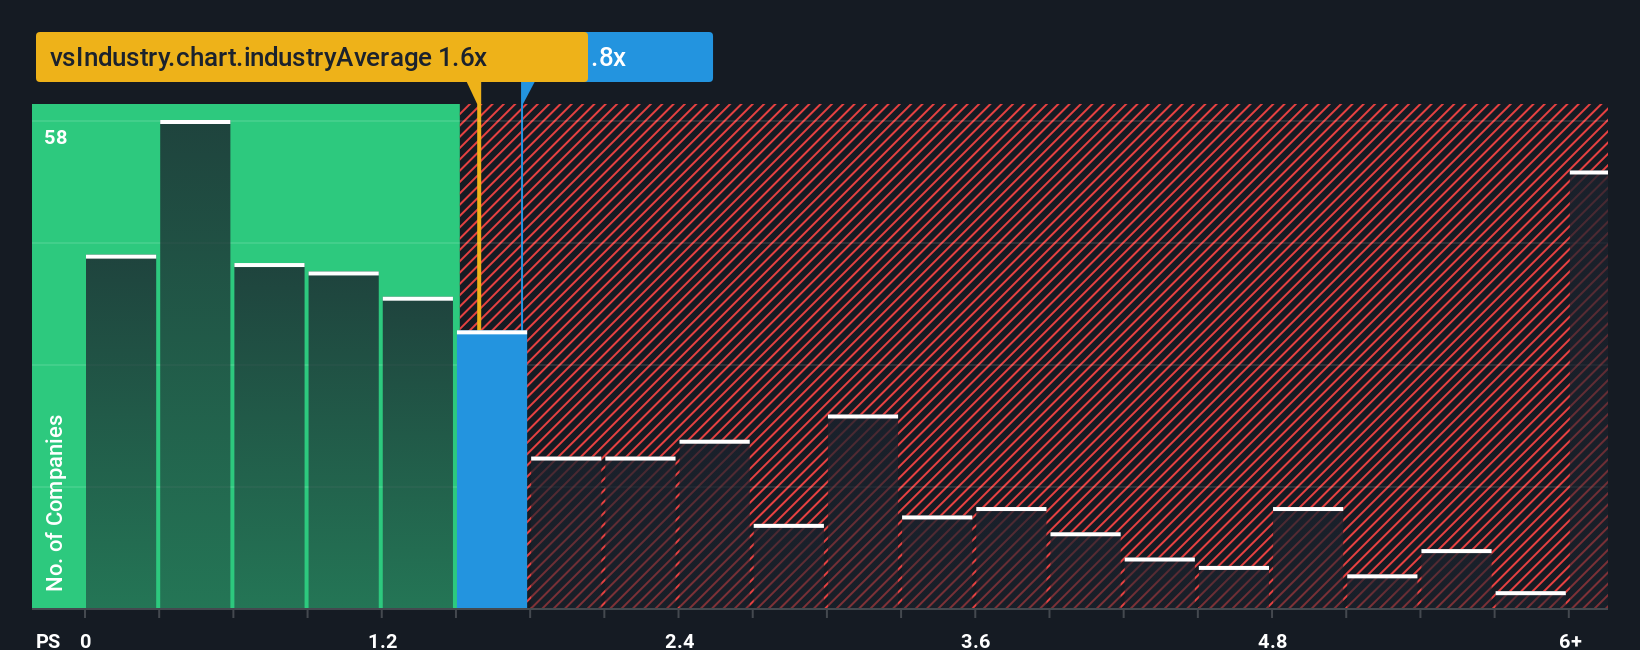
Although its price has surged higher, it would still be understandable if you think G3 Global Berhad is a stock with good investment prospects with a price-to-sales ratios (or "P/S") of 1.8x, considering almost half the companies in Malaysia's Healthcare industry have P/S ratios above 2.4x. Although, it's not wise to just take the P/S at face value as there may be an explanation why it's limited.
Check out our latest analysis for G3 Global Berhad
How G3 Global Berhad Has Been Performing
As an illustration, revenue has deteriorated at G3 Global Berhad over the last year, which is not ideal at all. Perhaps the market believes the recent revenue performance isn't good enough to keep up the industry, causing the P/S ratio to suffer. If you like the company, you'd be hoping this isn't the case so that you could potentially pick up some stock while it's out of favour.
We don't have analyst forecasts, but you can see how recent trends are setting up the company for the future by checking out our free report on G3 Global Berhad's earnings, revenue and cash flow.Is There Any Revenue Growth Forecasted For G3 Global Berhad?
The only time you'd be truly comfortable seeing a P/S as low as G3 Global Berhad's is when the company's growth is on track to lag the industry.
Taking a look back first, the company's revenue growth last year wasn't something to get excited about as it posted a disappointing decline of 38%. However, a few very strong years before that means that it was still able to grow revenue by an impressive 48% in total over the last three years. So we can start by confirming that the company has generally done a very good job of growing revenue over that time, even though it had some hiccups along the way.
Comparing that to the industry, which is only predicted to deliver 8.5% growth in the next 12 months, the company's momentum is stronger based on recent medium-term annualised revenue results.
In light of this, it's peculiar that G3 Global Berhad's P/S sits below the majority of other companies. It looks like most investors are not convinced the company can maintain its recent growth rates.
The Final Word
The latest share price surge wasn't enough to lift G3 Global Berhad's P/S close to the industry median. We'd say the price-to-sales ratio's power isn't primarily as a valuation instrument but rather to gauge current investor sentiment and future expectations.
Our examination of G3 Global Berhad revealed its three-year revenue trends aren't boosting its P/S anywhere near as much as we would have predicted, given they look better than current industry expectations. When we see robust revenue growth that outpaces the industry, we presume that there are notable underlying risks to the company's future performance, which is exerting downward pressure on the P/S ratio. It appears many are indeed anticipating revenue instability, because the persistence of these recent medium-term conditions would normally provide a boost to the share price.
It is also worth noting that we have found 2 warning signs for G3 Global Berhad (1 can't be ignored!) that you need to take into consideration.
If companies with solid past earnings growth is up your alley, you may wish to see this free collection of other companies with strong earnings growth and low P/E ratios.
New: Manage All Your Stock Portfolios in One Place
We've created the ultimate portfolio companion for stock investors, and it's free.
• Connect an unlimited number of Portfolios and see your total in one currency
• Be alerted to new Warning Signs or Risks via email or mobile
• Track the Fair Value of your stocks
Have feedback on this article? Concerned about the content? Get in touch with us directly. Alternatively, email editorial-team (at) simplywallst.com.
This article by Simply Wall St is general in nature. We provide commentary based on historical data and analyst forecasts only using an unbiased methodology and our articles are not intended to be financial advice. It does not constitute a recommendation to buy or sell any stock, and does not take account of your objectives, or your financial situation. We aim to bring you long-term focused analysis driven by fundamental data. Note that our analysis may not factor in the latest price-sensitive company announcements or qualitative material. Simply Wall St has no position in any stocks mentioned.
About KLSE:G3
G3 Global Berhad
An investment holding company, provides information and communication technology services in Malaysia.
Flawless balance sheet with very low risk.
Similar Companies
Market Insights

Advertisement
Community Narratives
The company that turned a verb into a global necessity and basically runs the modern internet, digital ads, smartphones, maps, and AI.
Fair Value US$300.00|10.2% undervalued
OS
Community Contributor
Flowers Foods Pays A Fair Price For Health
Fair Value US$16.12|20.3% undervalued
NV
Community Contributor
TMX Group will thrive with 33.3% profit margin and enduring market moat
Fair Value CA$49.90|0.1% undervalued
LI
Community Contributor