
Advertisement
- Malaysia
- /
- Hospitality
- /
- KLSE:OVERSEA
Investors Give Oversea Enterprise Berhad (KLSE:OVERSEA) Shares A 27% Hiding
The Oversea Enterprise Berhad (KLSE:OVERSEA) share price has softened a substantial 27% over the previous 30 days, handing back much of the gains the stock has made lately. The drop over the last 30 days has capped off a tough year for shareholders, with the share price down 20% in that time.
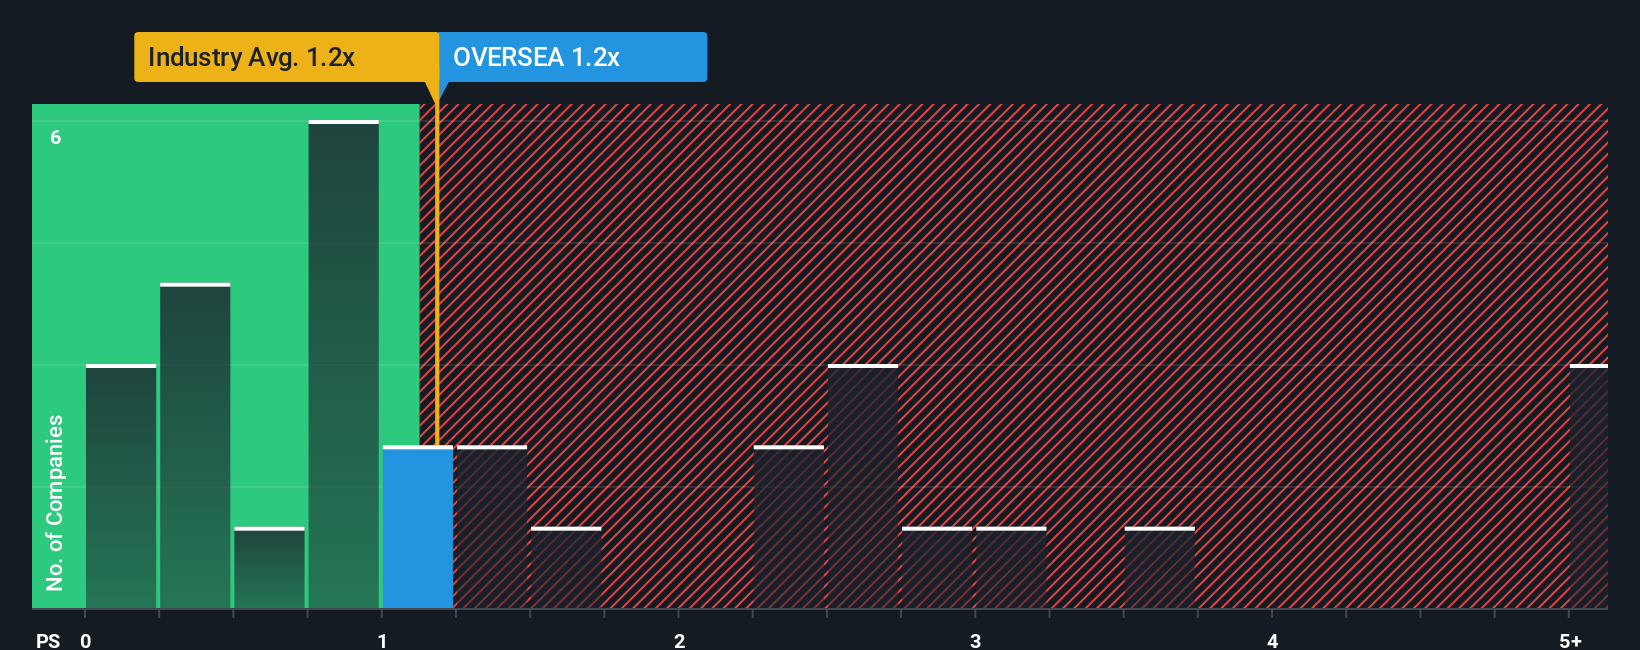
Although its price has dipped substantially, it's still not a stretch to say that Oversea Enterprise Berhad's price-to-sales (or "P/S") ratio of 1.2x right now seems quite "middle-of-the-road" compared to the Hospitality industry in Malaysia, seeing as it matches the P/S ratio of the wider industry. While this might not raise any eyebrows, if the P/S ratio is not justified investors could be missing out on a potential opportunity or ignoring looming disappointment.
Check out our latest analysis for Oversea Enterprise Berhad
How Oversea Enterprise Berhad Has Been Performing
The recent revenue growth at Oversea Enterprise Berhad would have to be considered satisfactory if not spectacular. Perhaps the expectation moving forward is that the revenue growth will track in line with the wider industry for the near term, which has kept the P/S subdued. If not, then at least existing shareholders probably aren't too pessimistic about the future direction of the share price.
Although there are no analyst estimates available for Oversea Enterprise Berhad, take a look at this free data-rich visualisation to see how the company stacks up on earnings, revenue and cash flow.Is There Some Revenue Growth Forecasted For Oversea Enterprise Berhad?
Oversea Enterprise Berhad's P/S ratio would be typical for a company that's only expected to deliver moderate growth, and importantly, perform in line with the industry.
Taking a look back first, we see that the company managed to grow revenues by a handy 4.4% last year. The latest three year period has also seen an excellent 108% overall rise in revenue, aided somewhat by its short-term performance. So we can start by confirming that the company has done a great job of growing revenues over that time.
Comparing that to the industry, which is only predicted to deliver 13% growth in the next 12 months, the company's momentum is stronger based on recent medium-term annualised revenue results.
In light of this, it's curious that Oversea Enterprise Berhad's P/S sits in line with the majority of other companies. It may be that most investors are not convinced the company can maintain its recent growth rates.
What Does Oversea Enterprise Berhad's P/S Mean For Investors?
With its share price dropping off a cliff, the P/S for Oversea Enterprise Berhad looks to be in line with the rest of the Hospitality industry. Generally, our preference is to limit the use of the price-to-sales ratio to establishing what the market thinks about the overall health of a company.
We've established that Oversea Enterprise Berhad currently trades on a lower than expected P/S since its recent three-year growth is higher than the wider industry forecast. It'd be fair to assume that potential risks the company faces could be the contributing factor to the lower than expected P/S. It appears some are indeed anticipating revenue instability, because the persistence of these recent medium-term conditions would normally provide a boost to the share price.
Plus, you should also learn about these 2 warning signs we've spotted with Oversea Enterprise Berhad (including 1 which is a bit unpleasant).
Of course, profitable companies with a history of great earnings growth are generally safer bets. So you may wish to see this free collection of other companies that have reasonable P/E ratios and have grown earnings strongly.
New: AI Stock Screener & Alerts
Our new AI Stock Screener scans the market every day to uncover opportunities.
• Dividend Powerhouses (3%+ Yield)
• Undervalued Small Caps with Insider Buying
• High growth Tech and AI Companies
Or build your own from over 50 metrics.
Have feedback on this article? Concerned about the content? Get in touch with us directly. Alternatively, email editorial-team (at) simplywallst.com.
This article by Simply Wall St is general in nature. We provide commentary based on historical data and analyst forecasts only using an unbiased methodology and our articles are not intended to be financial advice. It does not constitute a recommendation to buy or sell any stock, and does not take account of your objectives, or your financial situation. We aim to bring you long-term focused analysis driven by fundamental data. Note that our analysis may not factor in the latest price-sensitive company announcements or qualitative material. Simply Wall St has no position in any stocks mentioned.
About KLSE:OVERSEA
Oversea Enterprise Berhad
An investment holding company, operates a chain of Chinese restaurants primarily in Malaysia and the United States.
Excellent balance sheet with very low risk.
Market Insights

Advertisement
Community Narratives
The company that turned a verb into a global necessity and basically runs the modern internet, digital ads, smartphones, maps, and AI.
Fair Value US$300.00|6.2% undervalued
OS
Community Contributor
Flowers Foods Pays A Fair Price For Health
Fair Value US$16.12|25.1% undervalued
NV
Community Contributor
TMX Group will thrive with 33.3% profit margin and enduring market moat
Fair Value CA$49.90|0.04% overvalued
LI
Community Contributor