
Advertisement
- Malaysia
- /
- Consumer Durables
- /
- KLSE:SERNKOU
Optimistic Investors Push Sern Kou Resources Berhad (KLSE:SERNKOU) Shares Up 31% But Growth Is Lacking
Sern Kou Resources Berhad (KLSE:SERNKOU) shares have continued their recent momentum with a 31% gain in the last month alone. Looking further back, the 20% rise over the last twelve months isn't too bad notwithstanding the strength over the last 30 days.
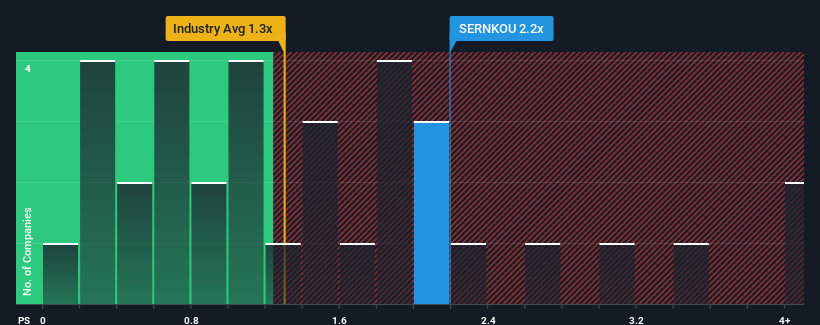
Following the firm bounce in price, you could be forgiven for thinking Sern Kou Resources Berhad is a stock not worth researching with a price-to-sales ratios (or "P/S") of 2.2x, considering almost half the companies in Malaysia's Consumer Durables industry have P/S ratios below 1.3x. Nonetheless, we'd need to dig a little deeper to determine if there is a rational basis for the elevated P/S.
Check out our latest analysis for Sern Kou Resources Berhad
What Does Sern Kou Resources Berhad's Recent Performance Look Like?
The revenue growth achieved at Sern Kou Resources Berhad over the last year would be more than acceptable for most companies. It might be that many expect the respectable revenue performance to beat most other companies over the coming period, which has increased investors’ willingness to pay up for the stock. If not, then existing shareholders may be a little nervous about the viability of the share price.
Although there are no analyst estimates available for Sern Kou Resources Berhad, take a look at this free data-rich visualisation to see how the company stacks up on earnings, revenue and cash flow.Is There Enough Revenue Growth Forecasted For Sern Kou Resources Berhad?
In order to justify its P/S ratio, Sern Kou Resources Berhad would need to produce impressive growth in excess of the industry.
If we review the last year of revenue growth, the company posted a worthy increase of 9.0%. Pleasingly, revenue has also lifted 34% in aggregate from three years ago, partly thanks to the last 12 months of growth. So we can start by confirming that the company has done a great job of growing revenues over that time.
Comparing that to the industry, which is predicted to deliver 18% growth in the next 12 months, the company's momentum is weaker, based on recent medium-term annualised revenue results.
With this information, we find it concerning that Sern Kou Resources Berhad is trading at a P/S higher than the industry. It seems most investors are ignoring the fairly limited recent growth rates and are hoping for a turnaround in the company's business prospects. Only the boldest would assume these prices are sustainable as a continuation of recent revenue trends is likely to weigh heavily on the share price eventually.
What Does Sern Kou Resources Berhad's P/S Mean For Investors?
Sern Kou Resources Berhad shares have taken a big step in a northerly direction, but its P/S is elevated as a result. We'd say the price-to-sales ratio's power isn't primarily as a valuation instrument but rather to gauge current investor sentiment and future expectations.
Our examination of Sern Kou Resources Berhad revealed its poor three-year revenue trends aren't detracting from the P/S as much as we though, given they look worse than current industry expectations. When we observe slower-than-industry revenue growth alongside a high P/S ratio, we assume there to be a significant risk of the share price decreasing, which would result in a lower P/S ratio. Unless the recent medium-term conditions improve markedly, it's very challenging to accept these the share price as being reasonable.
Plus, you should also learn about these 2 warning signs we've spotted with Sern Kou Resources Berhad (including 1 which is potentially serious).
If strong companies turning a profit tickle your fancy, then you'll want to check out this free list of interesting companies that trade on a low P/E (but have proven they can grow earnings).
New: Manage All Your Stock Portfolios in One Place
We've created the ultimate portfolio companion for stock investors, and it's free.
• Connect an unlimited number of Portfolios and see your total in one currency
• Be alerted to new Warning Signs or Risks via email or mobile
• Track the Fair Value of your stocks
Have feedback on this article? Concerned about the content? Get in touch with us directly. Alternatively, email editorial-team (at) simplywallst.com.
This article by Simply Wall St is general in nature. We provide commentary based on historical data and analyst forecasts only using an unbiased methodology and our articles are not intended to be financial advice. It does not constitute a recommendation to buy or sell any stock, and does not take account of your objectives, or your financial situation. We aim to bring you long-term focused analysis driven by fundamental data. Note that our analysis may not factor in the latest price-sensitive company announcements or qualitative material. Simply Wall St has no position in any stocks mentioned.
About KLSE:SERNKOU
Sern Kou Resources Berhad
An investment holding company, manufactures and trades in wooden furniture in Malaysia, the United States, Europe, and the Asia-Pacific.
Adequate balance sheet and overvalued.
Market Insights

Advertisement
Community Narratives
MicroVision will explode future revenue by 380.37% with a vision towards success
Fair Value US$60.00|98.5% undervalued
TH
Community Contributor
The Indispensable Artery for a New North American Economy
Fair Value CA$132.87|2.3% undervalued
TI
Community Contributor