
Advertisement
PRG Holdings Berhad's (KLSE:PRG) 26% Dip Still Leaving Some Shareholders Feeling Restless Over Its P/SRatio
To the annoyance of some shareholders, PRG Holdings Berhad (KLSE:PRG) shares are down a considerable 26% in the last month, which continues a horrid run for the company. For any long-term shareholders, the last month ends a year to forget by locking in a 50% share price decline.
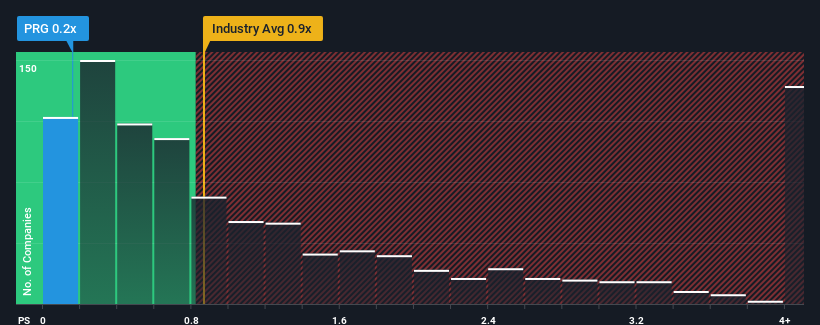
Even after such a large drop in price, you could still be forgiven for feeling indifferent about PRG Holdings Berhad's P/S ratio of 0.2x, since the median price-to-sales (or "P/S") ratio for the Luxury industry in Malaysia is also close to 0.6x. While this might not raise any eyebrows, if the P/S ratio is not justified investors could be missing out on a potential opportunity or ignoring looming disappointment.
Check out our latest analysis for PRG Holdings Berhad
What Does PRG Holdings Berhad's Recent Performance Look Like?
As an illustration, revenue has deteriorated at PRG Holdings Berhad over the last year, which is not ideal at all. It might be that many expect the company to put the disappointing revenue performance behind them over the coming period, which has kept the P/S from falling. If you like the company, you'd at least be hoping this is the case so that you could potentially pick up some stock while it's not quite in favour.
We don't have analyst forecasts, but you can see how recent trends are setting up the company for the future by checking out our free report on PRG Holdings Berhad's earnings, revenue and cash flow.How Is PRG Holdings Berhad's Revenue Growth Trending?
PRG Holdings Berhad's P/S ratio would be typical for a company that's only expected to deliver moderate growth, and importantly, perform in line with the industry.
Taking a look back first, the company's revenue growth last year wasn't something to get excited about as it posted a disappointing decline of 21%. Regardless, revenue has managed to lift by a handy 20% in aggregate from three years ago, thanks to the earlier period of growth. So we can start by confirming that the company has generally done a good job of growing revenue over that time, even though it had some hiccups along the way.
Comparing that to the industry, which is predicted to deliver 13% growth in the next 12 months, the company's momentum is weaker, based on recent medium-term annualised revenue results.
With this information, we find it interesting that PRG Holdings Berhad is trading at a fairly similar P/S compared to the industry. Apparently many investors in the company are less bearish than recent times would indicate and aren't willing to let go of their stock right now. Maintaining these prices will be difficult to achieve as a continuation of recent revenue trends is likely to weigh down the shares eventually.
The Bottom Line On PRG Holdings Berhad's P/S
Following PRG Holdings Berhad's share price tumble, its P/S is just clinging on to the industry median P/S. We'd say the price-to-sales ratio's power isn't primarily as a valuation instrument but rather to gauge current investor sentiment and future expectations.
We've established that PRG Holdings Berhad's average P/S is a bit surprising since its recent three-year growth is lower than the wider industry forecast. When we see weak revenue with slower than industry growth, we suspect the share price is at risk of declining, bringing the P/S back in line with expectations. Unless there is a significant improvement in the company's medium-term performance, it will be difficult to prevent the P/S ratio from declining to a more reasonable level.
You should always think about risks. Case in point, we've spotted 2 warning signs for PRG Holdings Berhad you should be aware of.
If strong companies turning a profit tickle your fancy, then you'll want to check out this free list of interesting companies that trade on a low P/E (but have proven they can grow earnings).
New: Manage All Your Stock Portfolios in One Place
We've created the ultimate portfolio companion for stock investors, and it's free.
• Connect an unlimited number of Portfolios and see your total in one currency
• Be alerted to new Warning Signs or Risks via email or mobile
• Track the Fair Value of your stocks
Have feedback on this article? Concerned about the content? Get in touch with us directly. Alternatively, email editorial-team (at) simplywallst.com.
This article by Simply Wall St is general in nature. We provide commentary based on historical data and analyst forecasts only using an unbiased methodology and our articles are not intended to be financial advice. It does not constitute a recommendation to buy or sell any stock, and does not take account of your objectives, or your financial situation. We aim to bring you long-term focused analysis driven by fundamental data. Note that our analysis may not factor in the latest price-sensitive company announcements or qualitative material. Simply Wall St has no position in any stocks mentioned.
About KLSE:PRG
PRG Holdings Berhad
An investment holding company, manufactures, markets, and sells rubber strips, yarn, webbing, and metal components.
Excellent balance sheet with low risk.
Market Insights

Advertisement
Community Narratives
MicroVision will explode future revenue by 380.37% with a vision towards success
Fair Value US$60|98.4% undervalued
TH
Community Contributor
The Indispensable Artery for a New North American Economy
Fair Value CA$132.87|0.7% overvalued
TI
Community Contributor
Recently Updated Narratives
NI

niteco on Texas Instruments ·
Engineered for Stability. Positioned for Growth.
Fair Value:US$314.4446.5% undervalued
1 followerusers have followed this narrative
0 commentsusers have commented on this narrative
0 likesusers have liked this narrative
BE


Bejgal on MINISO Group Holding ·
MINISO's fair value is projected at 26.69 with an anticipated PE ratio shift of 20x
Fair Value:US$28.1829.5% undervalued
46 followersusers have followed this narrative
3 commentsusers have commented on this narrative
0 likesusers have liked this narrative
BE

Bejgal on Fiverr International ·
Fiverr International will transform the freelance industry with AI-powered growth
Fair Value:US$36.8143.1% undervalued
79 followersusers have followed this narrative
7 commentsusers have commented on this narrative
0 likesusers have liked this narrative
Popular Narratives
TH

TheWallstreetKing on MicroVision ·
MicroVision will explode future revenue by 380.37% with a vision towards success
Fair Value:US$6098.4% undervalued
109 followersusers have followed this narrative
10 commentsusers have commented on this narrative
21 likesusers have liked this narrative
AN


AnalystConsensusTarget on NVIDIA ·
NVDA: Expanding AI Demand Will Drive Major Data Center Investments Through 2026
Fair Value:US$250.3929.3% undervalued
939 followersusers have followed this narrative
6 commentsusers have commented on this narrative
24 likesusers have liked this narrative
OS


oscargarcia on Alphabet ·
The company that turned a verb into a global necessity and basically runs the modern internet, digital ads, smartphones, maps, and AI.
Fair Value:US$3405.8% undervalued
145 followersusers have followed this narrative
6 commentsusers have commented on this narrative
18 likesusers have liked this narrative