
Advertisement
If we want to find a stock that could multiply over the long term, what are the underlying trends we should look for? Amongst other things, we'll want to see two things; firstly, a growing return on capital employed (ROCE) and secondly, an expansion in the company's amount of capital employed. Put simply, these types of businesses are compounding machines, meaning they are continually reinvesting their earnings at ever-higher rates of return. So when we looked at Zecon Berhad (KLSE:ZECON) and its trend of ROCE, we really liked what we saw.
Understanding Return On Capital Employed (ROCE)
For those who don't know, ROCE is a measure of a company's yearly pre-tax profit (its return), relative to the capital employed in the business. The formula for this calculation on Zecon Berhad is:
Return on Capital Employed = Earnings Before Interest and Tax (EBIT) ÷ (Total Assets - Current Liabilities)
0.049 = RM23m ÷ (RM1.7b - RM1.2b) (Based on the trailing twelve months to December 2020).
So, Zecon Berhad has an ROCE of 4.9%. Even though it's in line with the industry average of 4.9%, it's still a low return by itself.
Check out our latest analysis for Zecon Berhad
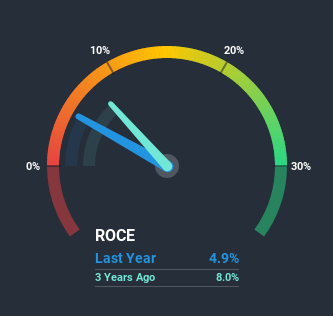
Historical performance is a great place to start when researching a stock so above you can see the gauge for Zecon Berhad's ROCE against it's prior returns. If you'd like to look at how Zecon Berhad has performed in the past in other metrics, you can view this free graph of past earnings, revenue and cash flow.
What Can We Tell From Zecon Berhad's ROCE Trend?
Zecon Berhad has recently broken into profitability so their prior investments seem to be paying off. Shareholders would no doubt be pleased with this because the business was loss-making five years ago but is is now generating 4.9% on its capital. Not only that, but the company is utilizing 117% more capital than before, but that's to be expected from a company trying to break into profitability. This can indicate that there's plenty of opportunities to invest capital internally and at ever higher rates, both common traits of a multi-bagger.
For the record though, there was a noticeable increase in the company's current liabilities over the period, so we would attribute some of the ROCE growth to that. Essentially the business now has suppliers or short-term creditors funding about 72% of its operations, which isn't ideal. Given it's pretty high ratio, we'd remind investors that having current liabilities at those levels can bring about some risks in certain businesses.
What We Can Learn From Zecon Berhad's ROCE
Overall, Zecon Berhad gets a big tick from us thanks in most part to the fact that it is now profitable and is reinvesting in its business. Astute investors may have an opportunity here because the stock has declined 41% in the last five years. With that in mind, we believe the promising trends warrant this stock for further investigation.
One more thing: We've identified 2 warning signs with Zecon Berhad (at least 1 which makes us a bit uncomfortable) , and understanding these would certainly be useful.
While Zecon Berhad isn't earning the highest return, check out this free list of companies that are earning high returns on equity with solid balance sheets.
If you’re looking to trade Zecon Berhad, open an account with the lowest-cost* platform trusted by professionals, Interactive Brokers. Their clients from over 200 countries and territories trade stocks, options, futures, forex, bonds and funds worldwide from a single integrated account. Promoted
Valuation is complex, but we're here to simplify it.
Discover if Zecon Berhad might be undervalued or overvalued with our detailed analysis, featuring fair value estimates, potential risks, dividends, insider trades, and its financial condition.
Access Free AnalysisThis article by Simply Wall St is general in nature. It does not constitute a recommendation to buy or sell any stock, and does not take account of your objectives, or your financial situation. We aim to bring you long-term focused analysis driven by fundamental data. Note that our analysis may not factor in the latest price-sensitive company announcements or qualitative material. Simply Wall St has no position in any stocks mentioned.
*Interactive Brokers Rated Lowest Cost Broker by StockBrokers.com Annual Online Review 2020
Have feedback on this article? Concerned about the content? Get in touch with us directly. Alternatively, email editorial-team (at) simplywallst.com.
About KLSE:ZECON
Zecon Berhad
Engages in the foundation engineering, civil engineering, building contracting, and related activities in Malaysia.
Moderate risk with acceptable track record.
Market Insights

Advertisement
Community Narratives
MINISO's fair value is projected at 26.69 with an anticipated PE ratio shift of 20x
Fair Value US$24.03|11.0% undervalued
BE
Community Contributor
Procter & Gamble: A Dividend Giant Facing Slowing Growth
Fair Value US$119.81|23.3% overvalued
AN
Community Contributor
Eli Lilly's Future Growth Driven by Tirzepatide and Favorable Market Conditions
Fair Value US$1.19k|13.8% undervalued
EA
Community Contributor