
Advertisement
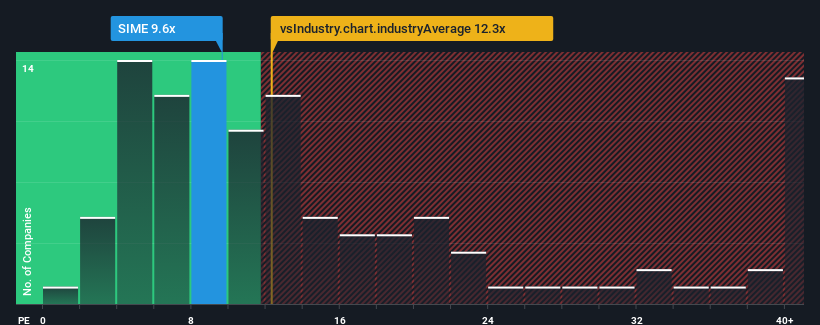
With a price-to-earnings (or "P/E") ratio of 9.6x Sime Darby Berhad (KLSE:SIME) may be sending bullish signals at the moment, given that almost half of all companies in Malaysia have P/E ratios greater than 14x and even P/E's higher than 25x are not unusual. Nonetheless, we'd need to dig a little deeper to determine if there is a rational basis for the reduced P/E.
We've discovered 2 warning signs about Sime Darby Berhad. View them for free.Sime Darby Berhad hasn't been tracking well recently as its declining earnings compare poorly to other companies, which have seen some growth on average. The P/E is probably low because investors think this poor earnings performance isn't going to get any better. If this is the case, then existing shareholders will probably struggle to get excited about the future direction of the share price.
See our latest analysis for Sime Darby Berhad
What Are Growth Metrics Telling Us About The Low P/E?
The only time you'd be truly comfortable seeing a P/E as low as Sime Darby Berhad's is when the company's growth is on track to lag the market.
Taking a look back first, the company's earnings per share growth last year wasn't something to get excited about as it posted a disappointing decline of 8.3%. However, a few very strong years before that means that it was still able to grow EPS by an impressive 35% in total over the last three years. So we can start by confirming that the company has generally done a very good job of growing earnings over that time, even though it had some hiccups along the way.
Turning to the outlook, the next three years should generate growth of 4.7% each year as estimated by the analysts watching the company. With the market predicted to deliver 10% growth per annum, the company is positioned for a weaker earnings result.
With this information, we can see why Sime Darby Berhad is trading at a P/E lower than the market. It seems most investors are expecting to see limited future growth and are only willing to pay a reduced amount for the stock.
The Key Takeaway
Typically, we'd caution against reading too much into price-to-earnings ratios when settling on investment decisions, though it can reveal plenty about what other market participants think about the company.
We've established that Sime Darby Berhad maintains its low P/E on the weakness of its forecast growth being lower than the wider market, as expected. At this stage investors feel the potential for an improvement in earnings isn't great enough to justify a higher P/E ratio. It's hard to see the share price rising strongly in the near future under these circumstances.
It's always necessary to consider the ever-present spectre of investment risk. We've identified 2 warning signs with Sime Darby Berhad, and understanding these should be part of your investment process.
If P/E ratios interest you, you may wish to see this free collection of other companies with strong earnings growth and low P/E ratios.
New: Manage All Your Stock Portfolios in One Place
We've created the ultimate portfolio companion for stock investors, and it's free.
• Connect an unlimited number of Portfolios and see your total in one currency
• Be alerted to new Warning Signs or Risks via email or mobile
• Track the Fair Value of your stocks
Have feedback on this article? Concerned about the content? Get in touch with us directly. Alternatively, email editorial-team (at) simplywallst.com.
This article by Simply Wall St is general in nature. We provide commentary based on historical data and analyst forecasts only using an unbiased methodology and our articles are not intended to be financial advice. It does not constitute a recommendation to buy or sell any stock, and does not take account of your objectives, or your financial situation. We aim to bring you long-term focused analysis driven by fundamental data. Note that our analysis may not factor in the latest price-sensitive company announcements or qualitative material. Simply Wall St has no position in any stocks mentioned.
About KLSE:SIME
Sime Darby Berhad
Provides automotive and industrial equipment in Malaysia, China, Australasia, and the Asia Pacific.
Undervalued with excellent balance sheet and pays a dividend.
Similar Companies
Market Insights

Advertisement
Community Narratives
MINISO's fair value is projected at 26.69 with an anticipated PE ratio shift of 20x
Fair Value US$24.03|9.0% undervalued
BE
Community Contributor
Procter & Gamble: A Dividend Giant Facing Slowing Growth
Fair Value US$119.81|23.5% overvalued
AN
Community Contributor
Eli Lilly's Future Growth Driven by Tirzepatide and Favorable Market Conditions
Fair Value US$1.19k|14.4% undervalued
EA
Community Contributor