
Advertisement
Sealink International Berhad (KLSE:SEALINK) Stock Rockets 25% But Many Are Still Ignoring The Company

Sealink International Berhad (KLSE:SEALINK) shares have continued their recent momentum with a 25% gain in the last month alone. The last 30 days were the cherry on top of the stock's 365% gain in the last year, which is nothing short of spectacular.
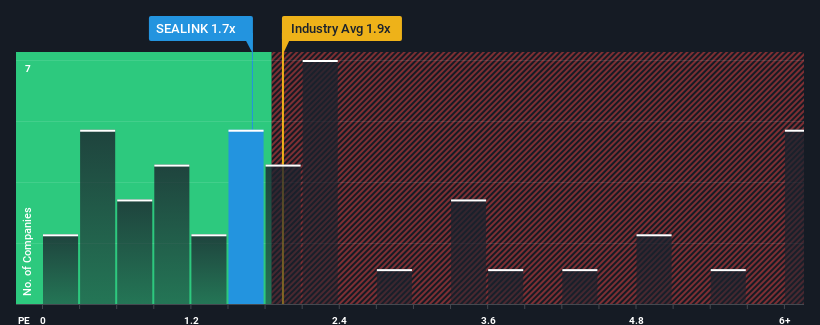
Although its price has surged higher, it's still not a stretch to say that Sealink International Berhad's price-to-sales (or "P/S") ratio of 1.7x right now seems quite "middle-of-the-road" compared to the Machinery industry in Malaysia, where the median P/S ratio is around 1.9x. Although, it's not wise to simply ignore the P/S without explanation as investors may be disregarding a distinct opportunity or a costly mistake.
View our latest analysis for Sealink International Berhad
What Does Sealink International Berhad's Recent Performance Look Like?
With revenue growth that's exceedingly strong of late, Sealink International Berhad has been doing very well. It might be that many expect the strong revenue performance to wane, which has kept the share price, and thus the P/S ratio, from rising. Those who are bullish on Sealink International Berhad will be hoping that this isn't the case, so that they can pick up the stock at a lower valuation.
Want the full picture on earnings, revenue and cash flow for the company? Then our free report on Sealink International Berhad will help you shine a light on its historical performance.How Is Sealink International Berhad's Revenue Growth Trending?
Sealink International Berhad's P/S ratio would be typical for a company that's only expected to deliver moderate growth, and importantly, perform in line with the industry.
If we review the last year of revenue growth, the company posted a terrific increase of 54%. The latest three year period has also seen an excellent 220% overall rise in revenue, aided by its short-term performance. So we can start by confirming that the company has done a great job of growing revenue over that time.
Comparing that recent medium-term revenue trajectory with the industry's one-year growth forecast of 22% shows it's noticeably more attractive.
With this information, we find it interesting that Sealink International Berhad is trading at a fairly similar P/S compared to the industry. Apparently some shareholders believe the recent performance is at its limits and have been accepting lower selling prices.
What We Can Learn From Sealink International Berhad's P/S?
Sealink International Berhad appears to be back in favour with a solid price jump bringing its P/S back in line with other companies in the industry Typically, we'd caution against reading too much into price-to-sales ratios when settling on investment decisions, though it can reveal plenty about what other market participants think about the company.
We've established that Sealink International Berhad currently trades on a lower than expected P/S since its recent three-year growth is higher than the wider industry forecast. It'd be fair to assume that potential risks the company faces could be the contributing factor to the lower than expected P/S. It appears some are indeed anticipating revenue instability, because the persistence of these recent medium-term conditions would normally provide a boost to the share price.
Before you take the next step, you should know about the 2 warning signs for Sealink International Berhad (1 makes us a bit uncomfortable!) that we have uncovered.
Of course, profitable companies with a history of great earnings growth are generally safer bets. So you may wish to see this free collection of other companies that have reasonable P/E ratios and have grown earnings strongly.
New: Manage All Your Stock Portfolios in One Place
We've created the ultimate portfolio companion for stock investors, and it's free.
• Connect an unlimited number of Portfolios and see your total in one currency
• Be alerted to new Warning Signs or Risks via email or mobile
• Track the Fair Value of your stocks
Have feedback on this article? Concerned about the content? Get in touch with us directly. Alternatively, email editorial-team (at) simplywallst.com.
This article by Simply Wall St is general in nature. We provide commentary based on historical data and analyst forecasts only using an unbiased methodology and our articles are not intended to be financial advice. It does not constitute a recommendation to buy or sell any stock, and does not take account of your objectives, or your financial situation. We aim to bring you long-term focused analysis driven by fundamental data. Note that our analysis may not factor in the latest price-sensitive company announcements or qualitative material. Simply Wall St has no position in any stocks mentioned.
About KLSE:SEALINK
Sealink International Berhad
An investment holding company, owns, builds, and operates a fleet of marine support vessels in Malaysia, Singapore, and Brazil.
Excellent balance sheet slight.
Market Insights

Advertisement
Community Narratives
Vita Life Sciences Set for a 12.72% Revenue Growth While Tackling Operational Challenges
Fair Value AU$2.42|9.1% undervalued
RO
Community Contributor
Vossloh rides a €500 billion wave to boost growth and earnings in the next decade
Fair Value €78.41|6.3% undervalued
CH
Community Contributor
Intuitive Surgical Will Transform Healthcare with 12% Revenue Growth
Fair Value US$325.55|56.5% overvalued
UN
Community Contributor