
Advertisement
- Malaysia
- /
- Industrials
- /
- KLSE:MUIIND
Some Malayan United Industries Berhad (KLSE:MUIIND) Shareholders Look For Exit As Shares Take 26% Pounding
Malayan United Industries Berhad (KLSE:MUIIND) shares have had a horrible month, losing 26% after a relatively good period beforehand. Indeed, the recent drop has reduced its annual gain to a relatively sedate 7.7% over the last twelve months.
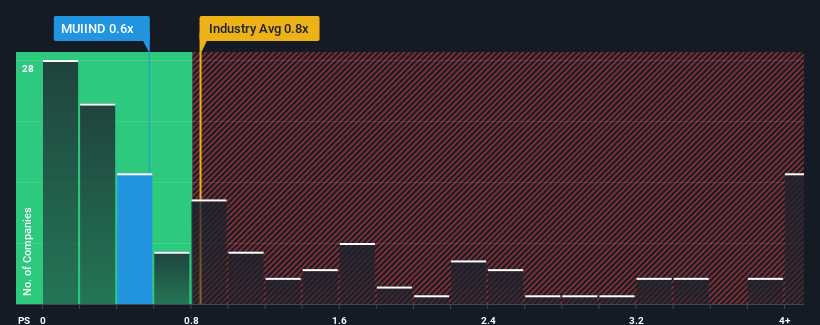
Even after such a large drop in price, you could still be forgiven for feeling indifferent about Malayan United Industries Berhad's P/S ratio of 0.6x, since the median price-to-sales (or "P/S") ratio for the Industrials industry in Malaysia is also close to 0.9x. While this might not raise any eyebrows, if the P/S ratio is not justified investors could be missing out on a potential opportunity or ignoring looming disappointment.
Check out our latest analysis for Malayan United Industries Berhad
What Does Malayan United Industries Berhad's P/S Mean For Shareholders?
As an illustration, revenue has deteriorated at Malayan United Industries Berhad over the last year, which is not ideal at all. One possibility is that the P/S is moderate because investors think the company might still do enough to be in line with the broader industry in the near future. If not, then existing shareholders may be a little nervous about the viability of the share price.
Although there are no analyst estimates available for Malayan United Industries Berhad, take a look at this free data-rich visualisation to see how the company stacks up on earnings, revenue and cash flow.Do Revenue Forecasts Match The P/S Ratio?
The only time you'd be comfortable seeing a P/S like Malayan United Industries Berhad's is when the company's growth is tracking the industry closely.
Retrospectively, the last year delivered a frustrating 18% decrease to the company's top line. Still, the latest three year period has seen an excellent 119% overall rise in revenue, in spite of its unsatisfying short-term performance. Accordingly, while they would have preferred to keep the run going, shareholders would definitely welcome the medium-term rates of revenue growth.
This is in contrast to the rest of the industry, which is expected to grow by 61% over the next year, materially higher than the company's recent medium-term annualised growth rates.
In light of this, it's curious that Malayan United Industries Berhad's P/S sits in line with the majority of other companies. It seems most investors are ignoring the fairly limited recent growth rates and are willing to pay up for exposure to the stock. Maintaining these prices will be difficult to achieve as a continuation of recent revenue trends is likely to weigh down the shares eventually.
What We Can Learn From Malayan United Industries Berhad's P/S?
Malayan United Industries Berhad's plummeting stock price has brought its P/S back to a similar region as the rest of the industry. Typically, we'd caution against reading too much into price-to-sales ratios when settling on investment decisions, though it can reveal plenty about what other market participants think about the company.
Our examination of Malayan United Industries Berhad revealed its poor three-year revenue trends aren't resulting in a lower P/S as per our expectations, given they look worse than current industry outlook. Right now we are uncomfortable with the P/S as this revenue performance isn't likely to support a more positive sentiment for long. Unless there is a significant improvement in the company's medium-term performance, it will be difficult to prevent the P/S ratio from declining to a more reasonable level.
We don't want to rain on the parade too much, but we did also find 2 warning signs for Malayan United Industries Berhad (1 is a bit unpleasant!) that you need to be mindful of.
If companies with solid past earnings growth is up your alley, you may wish to see this free collection of other companies with strong earnings growth and low P/E ratios.
New: Manage All Your Stock Portfolios in One Place
We've created the ultimate portfolio companion for stock investors, and it's free.
• Connect an unlimited number of Portfolios and see your total in one currency
• Be alerted to new Warning Signs or Risks via email or mobile
• Track the Fair Value of your stocks
Have feedback on this article? Concerned about the content? Get in touch with us directly. Alternatively, email editorial-team (at) simplywallst.com.
This article by Simply Wall St is general in nature. We provide commentary based on historical data and analyst forecasts only using an unbiased methodology and our articles are not intended to be financial advice. It does not constitute a recommendation to buy or sell any stock, and does not take account of your objectives, or your financial situation. We aim to bring you long-term focused analysis driven by fundamental data. Note that our analysis may not factor in the latest price-sensitive company announcements or qualitative material. Simply Wall St has no position in any stocks mentioned.
About KLSE:MUIIND
Malayan United Industries Berhad
An investment holding company, primarily engages in the retailing, hotel, property, food, fast food chain, and financial service businesses in Malaysia, the Asia-Pacific, Australia, North America, and the United Kingdom.
Low and slightly overvalued.
Market Insights


Advertisement
Community Narratives
A case for TSXV:USA to reach USD $5.00 - $9.00 (CAD $7.30–$12.29) by 2029.
Fair Value CA$12.29|91.2% undervalued
AG
Community Contributor
DLocal's Future Growth Fueled by 35% Revenue and Profit Margin Boosts
Fair Value US$195.39|94.1% undervalued
WY
Community Contributor
Historically Cheap, but the Margin of Safety Is Still Thin
Fair Value SEK 232.58|13.2% undervalued
MA
Community Contributor