
Advertisement
CME Group Berhad (KLSE:CME) Has Debt But No Earnings; Should You Worry?
Legendary fund manager Li Lu (who Charlie Munger backed) once said, 'The biggest investment risk is not the volatility of prices, but whether you will suffer a permanent loss of capital.' So it might be obvious that you need to consider debt, when you think about how risky any given stock is, because too much debt can sink a company. We note that CME Group Berhad (KLSE:CME) does have debt on its balance sheet. But is this debt a concern to shareholders?
Why Does Debt Bring Risk?
Debt is a tool to help businesses grow, but if a business is incapable of paying off its lenders, then it exists at their mercy. Part and parcel of capitalism is the process of 'creative destruction' where failed businesses are mercilessly liquidated by their bankers. However, a more usual (but still expensive) situation is where a company must dilute shareholders at a cheap share price simply to get debt under control. Of course, plenty of companies use debt to fund growth, without any negative consequences. When we think about a company's use of debt, we first look at cash and debt together.
View our latest analysis for CME Group Berhad
How Much Debt Does CME Group Berhad Carry?
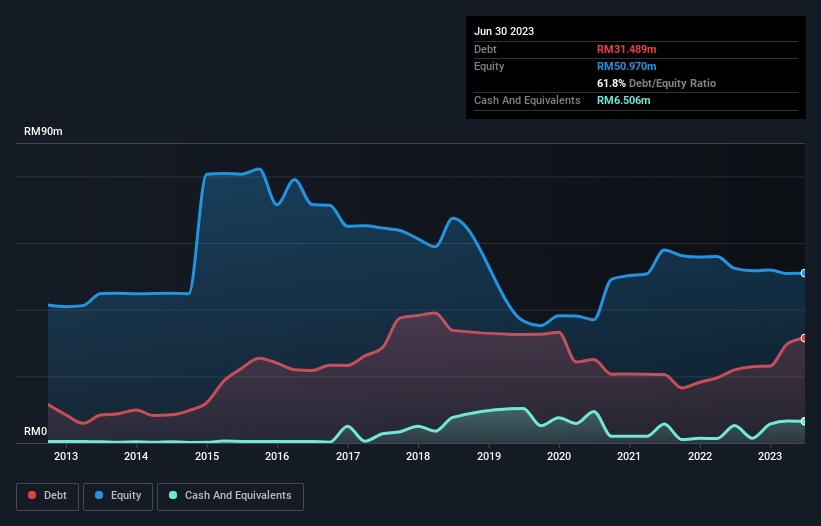
You can click the graphic below for the historical numbers, but it shows that as of June 2023 CME Group Berhad had RM31.5m of debt, an increase on RM22.0m, over one year. On the flip side, it has RM6.51m in cash leading to net debt of about RM25.0m.
A Look At CME Group Berhad's Liabilities
We can see from the most recent balance sheet that CME Group Berhad had liabilities of RM50.7m falling due within a year, and liabilities of RM3.35m due beyond that. Offsetting these obligations, it had cash of RM6.51m as well as receivables valued at RM13.3m due within 12 months. So its liabilities total RM34.2m more than the combination of its cash and short-term receivables.
This is a mountain of leverage relative to its market capitalization of RM36.2m. Should its lenders demand that it shore up the balance sheet, shareholders would likely face severe dilution. The balance sheet is clearly the area to focus on when you are analysing debt. But it is CME Group Berhad's earnings that will influence how the balance sheet holds up in the future. So if you're keen to discover more about its earnings, it might be worth checking out this graph of its long term earnings trend.
In the last year CME Group Berhad had a loss before interest and tax, and actually shrunk its revenue by 24%, to RM12m. That makes us nervous, to say the least.
Caveat Emptor
Not only did CME Group Berhad's revenue slip over the last twelve months, but it also produced negative earnings before interest and tax (EBIT). To be specific the EBIT loss came in at RM497k. Considering that alongside the liabilities mentioned above does not give us much confidence that company should be using so much debt. Quite frankly we think the balance sheet is far from match-fit, although it could be improved with time. However, it doesn't help that it burned through RM3.5m of cash over the last year. So in short it's a really risky stock. When analysing debt levels, the balance sheet is the obvious place to start. But ultimately, every company can contain risks that exist outside of the balance sheet. We've identified 4 warning signs with CME Group Berhad (at least 2 which are concerning) , and understanding them should be part of your investment process.
Of course, if you're the type of investor who prefers buying stocks without the burden of debt, then don't hesitate to discover our exclusive list of net cash growth stocks, today.
New: AI Stock Screener & Alerts
Our new AI Stock Screener scans the market every day to uncover opportunities.
• Dividend Powerhouses (3%+ Yield)
• Undervalued Small Caps with Insider Buying
• High growth Tech and AI Companies
Or build your own from over 50 metrics.
Have feedback on this article? Concerned about the content? Get in touch with us directly. Alternatively, email editorial-team (at) simplywallst.com.
This article by Simply Wall St is general in nature. We provide commentary based on historical data and analyst forecasts only using an unbiased methodology and our articles are not intended to be financial advice. It does not constitute a recommendation to buy or sell any stock, and does not take account of your objectives, or your financial situation. We aim to bring you long-term focused analysis driven by fundamental data. Note that our analysis may not factor in the latest price-sensitive company announcements or qualitative material. Simply Wall St has no position in any stocks mentioned.
About KLSE:CME
CME Group Berhad
An investment holding company, designs, manufactures, sells, and services firefighting and specialist vehicles primarily in Malaysia.
Moderate risk and slightly overvalued.
Market Insights

Advertisement
Community Narratives
MicroVision will explode future revenue by 380.37% with a vision towards success
Fair Value US$60.00|98.4% undervalued
TH
Community Contributor
The Indispensable Artery for a New North American Economy
Fair Value CA$132.87|1.3% undervalued
TI
Community Contributor