
Advertisement
Investors Appear Satisfied With AT Systematization Berhad's (KLSE:AT) Prospects As Shares Rocket 100%
AT Systematization Berhad (KLSE:AT) shareholders would be excited to see that the share price has had a great month, posting a 100% gain and recovering from prior weakness. Unfortunately, the gains of the last month did little to right the losses of the last year with the stock still down 33% over that time.
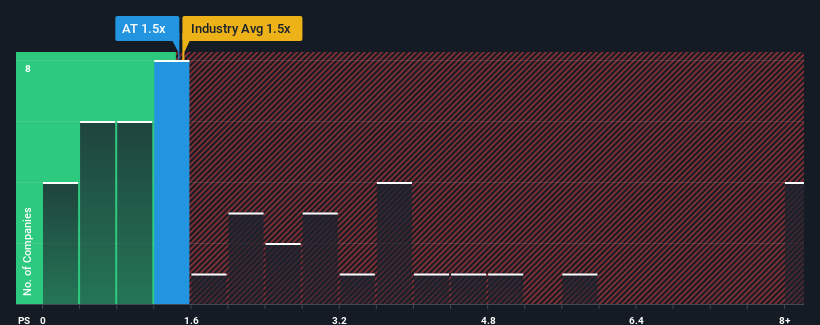
Although its price has surged higher, it's still not a stretch to say that AT Systematization Berhad's price-to-sales (or "P/S") ratio of 1.5x right now seems quite "middle-of-the-road" compared to the Machinery industry in Malaysia, seeing as it matches the P/S ratio of the wider industry. Although, it's not wise to simply ignore the P/S without explanation as investors may be disregarding a distinct opportunity or a costly mistake.
Check out our latest analysis for AT Systematization Berhad
How AT Systematization Berhad Has Been Performing
As an illustration, revenue has deteriorated at AT Systematization Berhad over the last year, which is not ideal at all. One possibility is that the P/S is moderate because investors think the company might still do enough to be in line with the broader industry in the near future. If not, then existing shareholders may be a little nervous about the viability of the share price.
Although there are no analyst estimates available for AT Systematization Berhad, take a look at this free data-rich visualisation to see how the company stacks up on earnings, revenue and cash flow.What Are Revenue Growth Metrics Telling Us About The P/S?
The only time you'd be comfortable seeing a P/S like AT Systematization Berhad's is when the company's growth is tracking the industry closely.
Retrospectively, the last year delivered a frustrating 26% decrease to the company's top line. Even so, admirably revenue has lifted 89% in aggregate from three years ago, notwithstanding the last 12 months. Accordingly, while they would have preferred to keep the run going, shareholders would definitely welcome the medium-term rates of revenue growth.
It's interesting to note that the rest of the industry is similarly expected to grow by 25% over the next year, which is fairly even with the company's recent medium-term annualised growth rates.
With this information, we can see why AT Systematization Berhad is trading at a fairly similar P/S to the industry. Apparently shareholders are comfortable to simply hold on assuming the company will continue keeping a low profile.
The Final Word
AT Systematization Berhad's stock has a lot of momentum behind it lately, which has brought its P/S level with the rest of the industry. It's argued the price-to-sales ratio is an inferior measure of value within certain industries, but it can be a powerful business sentiment indicator.
As we've seen, AT Systematization Berhad's three-year revenue trends seem to be contributing to its P/S, given they look similar to current industry expectations. With previous revenue trends that keep up with the current industry outlook, it's hard to justify the company's P/S ratio deviating much from it's current point. If recent medium-term revenue trends continue, it's hard to see the share price moving strongly in either direction in the near future under these circumstances.
You should always think about risks. Case in point, we've spotted 4 warning signs for AT Systematization Berhad you should be aware of, and 2 of them are concerning.
If these risks are making you reconsider your opinion on AT Systematization Berhad, explore our interactive list of high quality stocks to get an idea of what else is out there.
Valuation is complex, but we're here to simplify it.
Discover if Erdasan Group Berhad might be undervalued or overvalued with our detailed analysis, featuring fair value estimates, potential risks, dividends, insider trades, and its financial condition.
Access Free AnalysisHave feedback on this article? Concerned about the content? Get in touch with us directly. Alternatively, email editorial-team (at) simplywallst.com.
This article by Simply Wall St is general in nature. We provide commentary based on historical data and analyst forecasts only using an unbiased methodology and our articles are not intended to be financial advice. It does not constitute a recommendation to buy or sell any stock, and does not take account of your objectives, or your financial situation. We aim to bring you long-term focused analysis driven by fundamental data. Note that our analysis may not factor in the latest price-sensitive company announcements or qualitative material. Simply Wall St has no position in any stocks mentioned.
About KLSE:ERDASAN
Erdasan Group Berhad
An investment holding company, designs, manufactures, and fabricates industrial automation systems, machinery, and industrial and engineering parts.
Excellent balance sheet with acceptable track record.
Similar Companies
Market Insights

Advertisement
Weekly Picks
RO


RockeTeller on Santacruz Silver Mining ·
Crazy Undervalued 42 Baggers Silver Play (Active & Running Mine)
Fair Value:CA$8696.4% undervalued
41 followersusers have followed this narrative
6 commentsusers have commented on this narrative
14 likesusers have liked this narrative
RO


Robbo on Fiducian Group ·
Fiducian: Compliance Clouds or Value Opportunity?
Fair Value:AU$123.8% undervalued
5 followersusers have followed this narrative
0 commentsusers have commented on this narrative
0 likesusers have liked this narrative
WO

woodworthfund on Willamette Valley Vineyards ·
Willamette Valley Vineyards (WVVI): Not-So-Great Value
Fair Value:US$244.5% overvalued
7 followersusers have followed this narrative
0 commentsusers have commented on this narrative
1 likeusers have liked this narrative
Recently Updated Narratives
SC

scm on Text ·
TXT will see revenue grow 26% with a profit margin boost of almost 40%
Fair Value:zł8049.8% undervalued
3 followersusers have followed this narrative
0 commentsusers have commented on this narrative
0 likesusers have liked this narrative
VL

Vladislav on Galleon Gold ·
Significantly undervalued gold explorer in Timmins, finally getting traction
Fair Value:CA$482.9% undervalued
2 followersusers have followed this narrative
0 commentsusers have commented on this narrative
0 likesusers have liked this narrative
FU

FundamentallySarcastic on Credit Corp Group ·
Moderation and Stabilisation: HOLD: Fair Price based on a 4-year Cycle is $12.08
Fair Value:AU$12.6411.8% overvalued
3 followersusers have followed this narrative
0 commentsusers have commented on this narrative
0 likesusers have liked this narrative
Popular Narratives
TH


TheWallstreetKing on MicroVision ·
MicroVision will explode future revenue by 380.37% with a vision towards success
Fair Value:US$6098.5% undervalued
116 followersusers have followed this narrative
11 commentsusers have commented on this narrative
22 likesusers have liked this narrative
AN


AnalystConsensusTarget on NVIDIA ·
NVDA: Expanding AI Demand Will Drive Major Data Center Investments Through 2026
Fair Value:US$250.3928.3% undervalued
955 followersusers have followed this narrative
6 commentsusers have commented on this narrative
25 likesusers have liked this narrative
OS


oscargarcia on Alphabet ·
The company that turned a verb into a global necessity and basically runs the modern internet, digital ads, smartphones, maps, and AI.
Fair Value:US$3406.0% undervalued
147 followersusers have followed this narrative
6 commentsusers have commented on this narrative
18 likesusers have liked this narrative

