Stock Analysis
- Malaysia
- /
- Construction
- /
- KLSE:AME
Should We Be Excited About The Trends Of Returns At AME Elite Consortium Berhad (KLSE:AME)?


If we want to find a potential multi-bagger, often there are underlying trends that can provide clues. Firstly, we'd want to identify a growing return on capital employed (ROCE) and then alongside that, an ever-increasing base of capital employed. If you see this, it typically means it's a company with a great business model and plenty of profitable reinvestment opportunities. Although, when we looked at AME Elite Consortium Berhad (KLSE:AME), it didn't seem to tick all of these boxes.
What is Return On Capital Employed (ROCE)?
For those that aren't sure what ROCE is, it measures the amount of pre-tax profits a company can generate from the capital employed in its business. Analysts use this formula to calculate it for AME Elite Consortium Berhad:
Return on Capital Employed = Earnings Before Interest and Tax (EBIT) ÷ (Total Assets - Current Liabilities)
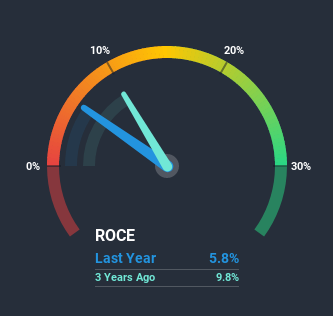
0.058 = RM55m ÷ (RM1.1b - RM192m) (Based on the trailing twelve months to September 2020).
Thus, AME Elite Consortium Berhad has an ROCE of 5.8%. In absolute terms, that's a low return but it's around the Construction industry average of 5.2%.
View our latest analysis for AME Elite Consortium Berhad
In the above chart we have measured AME Elite Consortium Berhad's prior ROCE against its prior performance, but the future is arguably more important. If you'd like, you can check out the forecasts from the analysts covering AME Elite Consortium Berhad here for free.
What Can We Tell From AME Elite Consortium Berhad's ROCE Trend?
In terms of AME Elite Consortium Berhad's historical ROCE movements, the trend isn't fantastic. To be more specific, ROCE has fallen from 8.8% over the last four years. However it looks like AME Elite Consortium Berhad might be reinvesting for long term growth because while capital employed has increased, the company's sales haven't changed much in the last 12 months. It may take some time before the company starts to see any change in earnings from these investments.
On a side note, AME Elite Consortium Berhad has done well to pay down its current liabilities to 17% of total assets. So we could link some of this to the decrease in ROCE. Effectively this means their suppliers or short-term creditors are funding less of the business, which reduces some elements of risk. Since the business is basically funding more of its operations with it's own money, you could argue this has made the business less efficient at generating ROCE.What We Can Learn From AME Elite Consortium Berhad's ROCE
To conclude, we've found that AME Elite Consortium Berhad is reinvesting in the business, but returns have been falling. Since the stock has gained an impressive 20% over the last year, investors must think there's better things to come. However, unless these underlying trends turn more positive, we wouldn't get our hopes up too high.
AME Elite Consortium Berhad does have some risks though, and we've spotted 2 warning signs for AME Elite Consortium Berhad that you might be interested in.
If you want to search for solid companies with great earnings, check out this free list of companies with good balance sheets and impressive returns on equity.
If you’re looking to trade AME Elite Consortium Berhad, open an account with the lowest-cost* platform trusted by professionals, Interactive Brokers. Their clients from over 200 countries and territories trade stocks, options, futures, forex, bonds and funds worldwide from a single integrated account. Promoted
Valuation is complex, but we're helping make it simple.
Find out whether AME Elite Consortium Berhad is potentially over or undervalued by checking out our comprehensive analysis, which includes fair value estimates, risks and warnings, dividends, insider transactions and financial health.
View the Free AnalysisThis article by Simply Wall St is general in nature. It does not constitute a recommendation to buy or sell any stock, and does not take account of your objectives, or your financial situation. We aim to bring you long-term focused analysis driven by fundamental data. Note that our analysis may not factor in the latest price-sensitive company announcements or qualitative material. Simply Wall St has no position in any stocks mentioned.
*Interactive Brokers Rated Lowest Cost Broker by StockBrokers.com Annual Online Review 2020
Have feedback on this article? Concerned about the content? Get in touch with us directly. Alternatively, email editorial-team (at) simplywallst.com.
About KLSE:AME
AME Elite Consortium Berhad
An investment holding company, engages in the construction business in Malaysia.
Very undervalued with flawless balance sheet.
