
Advertisement
- Malaysia
- /
- Auto Components
- /
- KLSE:PECCA
Pecca Group Berhad's (KLSE:PECCA) Shareholders Have More To Worry About Than Only Soft Earnings
Despite Pecca Group Berhad's (KLSE:PECCA) recent earnings report having lackluster headline numbers, the market responded positively. While shareholders may be willing to overlook soft profit numbers, we believe that they should also be taking into account some other factors which may be cause for concern.
See our latest analysis for Pecca Group Berhad
Zooming In On Pecca Group Berhad's Earnings
One key financial ratio used to measure how well a company converts its profit to free cash flow (FCF) is the accrual ratio. The accrual ratio subtracts the FCF from the profit for a given period, and divides the result by the average operating assets of the company over that time. You could think of the accrual ratio from cashflow as the 'non-FCF profit ratio'.
Therefore, it's actually considered a good thing when a company has a negative accrual ratio, but a bad thing if its accrual ratio is positive. That is not intended to imply we should worry about a positive accrual ratio, but it's worth noting where the accrual ratio is rather high. To quote a 2014 paper by Lewellen and Resutek, "firms with higher accruals tend to be less profitable in the future".
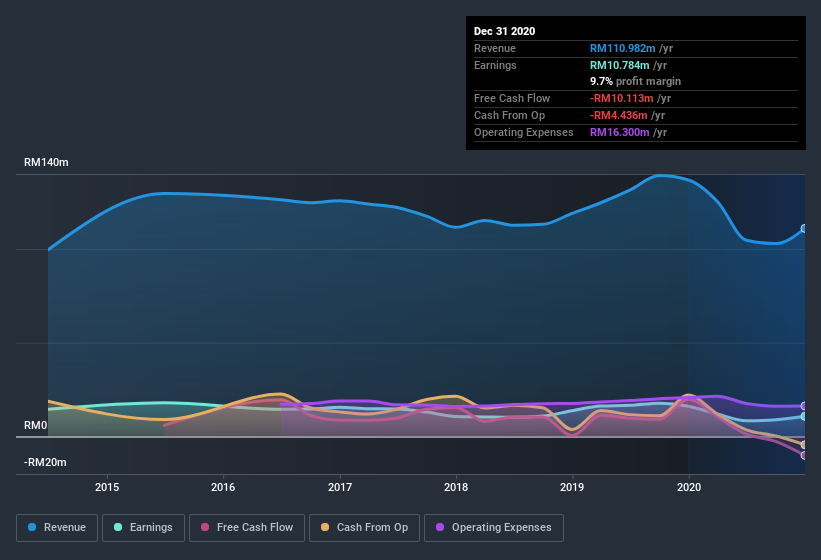
Pecca Group Berhad has an accrual ratio of 0.27 for the year to December 2020. Therefore, we know that it's free cashflow was significantly lower than its statutory profit, which is hardly a good thing. In the last twelve months it actually had negative free cash flow, with an outflow of RM10m despite its profit of RM10.8m, mentioned above. It's worth noting that Pecca Group Berhad generated positive FCF of RM20m a year ago, so at least they've done it in the past. One positive for Pecca Group Berhad shareholders is that it's accrual ratio was significantly better last year, providing reason to believe that it may return to stronger cash conversion in the future. As a result, some shareholders may be looking for stronger cash conversion in the current year.
That might leave you wondering what analysts are forecasting in terms of future profitability. Luckily, you can click here to see an interactive graph depicting future profitability, based on their estimates.
Our Take On Pecca Group Berhad's Profit Performance
Pecca Group Berhad's accrual ratio for the last twelve months signifies cash conversion is less than ideal, which is a negative when it comes to our view of its earnings. Because of this, we think that it may be that Pecca Group Berhad's statutory profits are better than its underlying earnings power. Nonetheless, it's still worth noting that its earnings per share have grown at 7.1% over the last three years. Of course, we've only just scratched the surface when it comes to analysing its earnings; one could also consider margins, forecast growth, and return on investment, among other factors. So if you'd like to dive deeper into this stock, it's crucial to consider any risks it's facing. For instance, we've identified 3 warning signs for Pecca Group Berhad (1 can't be ignored) you should be familiar with.
Today we've zoomed in on a single data point to better understand the nature of Pecca Group Berhad's profit. But there is always more to discover if you are capable of focussing your mind on minutiae. Some people consider a high return on equity to be a good sign of a quality business. While it might take a little research on your behalf, you may find this free collection of companies boasting high return on equity, or this list of stocks that insiders are buying to be useful.
If you decide to trade Pecca Group Berhad, use the lowest-cost* platform that is rated #1 Overall by Barron’s, Interactive Brokers. Trade stocks, options, futures, forex, bonds and funds on 135 markets, all from a single integrated account. Promoted
New: Manage All Your Stock Portfolios in One Place
We've created the ultimate portfolio companion for stock investors, and it's free.
• Connect an unlimited number of Portfolios and see your total in one currency
• Be alerted to new Warning Signs or Risks via email or mobile
• Track the Fair Value of your stocks
This article by Simply Wall St is general in nature. It does not constitute a recommendation to buy or sell any stock, and does not take account of your objectives, or your financial situation. We aim to bring you long-term focused analysis driven by fundamental data. Note that our analysis may not factor in the latest price-sensitive company announcements or qualitative material. Simply Wall St has no position in any stocks mentioned.
*Interactive Brokers Rated Lowest Cost Broker by StockBrokers.com Annual Online Review 2020
Have feedback on this article? Concerned about the content? Get in touch with us directly. Alternatively, email editorial-team (at) simplywallst.com.
About KLSE:PECCA
Pecca Group Berhad
Provides automotive leather upholstery products and services in Malaysia, Indonesia, Thailand, and internationally.
Excellent balance sheet with proven track record.
Similar Companies
Market Insights

Advertisement
Community Narratives
MicroVision will explode future revenue by 380.37% with a vision towards success
Fair Value US$60.00|98.4% undervalued
TH
Community Contributor
The Indispensable Artery for a New North American Economy
Fair Value CA$132.87|1.3% undervalued
TI
Community Contributor