
Advertisement
- Mexico
- /
- Household Products
- /
- BMV:KIMBER A
Kimberly-Clark de México, S. A. B. de C. V. (BMV:KIMBERA) Shares Could Be 25% Below Their Intrinsic Value Estimate

Key Insights
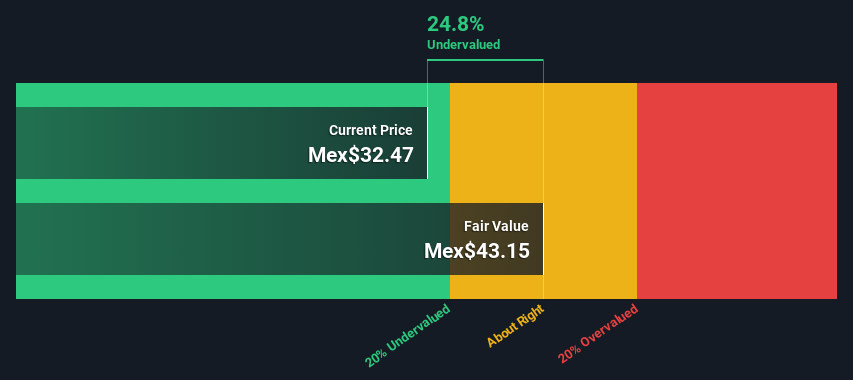
- The projected fair value for Kimberly-Clark de México S. A. B. de C. V is Mex$43.15 based on 2 Stage Free Cash Flow to Equity
- Kimberly-Clark de México S. A. B. de C. V's Mex$32.47 share price signals that it might be 25% undervalued
- Our fair value estimate is 1.6% lower than Kimberly-Clark de México S. A. B. de C. V's analyst price target of Mex$43.85
Today we'll do a simple run through of a valuation method used to estimate the attractiveness of Kimberly-Clark de México, S. A. B. de C. V. (BMV:KIMBERA) as an investment opportunity by taking the expected future cash flows and discounting them to today's value. We will use the Discounted Cash Flow (DCF) model on this occasion. Don't get put off by the jargon, the math behind it is actually quite straightforward.
Remember though, that there are many ways to estimate a company's value, and a DCF is just one method. For those who are keen learners of equity analysis, the Simply Wall St analysis model here may be something of interest to you.
Check out our latest analysis for Kimberly-Clark de México S. A. B. de C. V
The Method
We use what is known as a 2-stage model, which simply means we have two different periods of growth rates for the company's cash flows. Generally the first stage is higher growth, and the second stage is a lower growth phase. To begin with, we have to get estimates of the next ten years of cash flows. Where possible we use analyst estimates, but when these aren't available we extrapolate the previous free cash flow (FCF) from the last estimate or reported value. We assume companies with shrinking free cash flow will slow their rate of shrinkage, and that companies with growing free cash flow will see their growth rate slow, over this period. We do this to reflect that growth tends to slow more in the early years than it does in later years.
Generally we assume that a dollar today is more valuable than a dollar in the future, and so the sum of these future cash flows is then discounted to today's value:
10-year free cash flow (FCF) estimate
| 2025 | 2026 | 2027 | 2028 | 2029 | 2030 | 2031 | 2032 | 2033 | 2034 | |
| Levered FCF (MX$, Millions) | Mex$9.31b | Mex$10.5b | Mex$10.3b | Mex$10.5b | Mex$10.9b | Mex$11.4b | Mex$12.1b | Mex$12.8b | Mex$13.7b | Mex$14.7b |
| Growth Rate Estimate Source | Analyst x1 | Analyst x1 | Analyst x1 | Est @ 1.67% | Est @ 3.50% | Est @ 4.79% | Est @ 5.68% | Est @ 6.31% | Est @ 6.75% | Est @ 7.06% |
| Present Value (MX$, Millions) Discounted @ 14% | Mex$8.2k | Mex$8.1k | Mex$7.0k | Mex$6.3k | Mex$5.7k | Mex$5.3k | Mex$4.9k | Mex$4.6k | Mex$4.3k | Mex$4.1k |
("Est" = FCF growth rate estimated by Simply Wall St)
Present Value of 10-year Cash Flow (PVCF) = Mex$59b
We now need to calculate the Terminal Value, which accounts for all the future cash flows after this ten year period. The Gordon Growth formula is used to calculate Terminal Value at a future annual growth rate equal to the 5-year average of the 10-year government bond yield of 7.8%. We discount the terminal cash flows to today's value at a cost of equity of 14%.
Terminal Value (TV)= FCF2034 × (1 + g) ÷ (r – g) = Mex$15b× (1 + 7.8%) ÷ (14%– 7.8%) = Mex$267b
Present Value of Terminal Value (PVTV)= TV / (1 + r)10= Mex$267b÷ ( 1 + 14%)10= Mex$74b
The total value, or equity value, is then the sum of the present value of the future cash flows, which in this case is Mex$133b. To get the intrinsic value per share, we divide this by the total number of shares outstanding. Relative to the current share price of Mex$32.5, the company appears a touch undervalued at a 25% discount to where the stock price trades currently. The assumptions in any calculation have a big impact on the valuation, so it is better to view this as a rough estimate, not precise down to the last cent.
The Assumptions
The calculation above is very dependent on two assumptions. The first is the discount rate and the other is the cash flows. You don't have to agree with these inputs, I recommend redoing the calculations yourself and playing with them. The DCF also does not consider the possible cyclicality of an industry, or a company's future capital requirements, so it does not give a full picture of a company's potential performance. Given that we are looking at Kimberly-Clark de México S. A. B. de C. V as potential shareholders, the cost of equity is used as the discount rate, rather than the cost of capital (or weighted average cost of capital, WACC) which accounts for debt. In this calculation we've used 14%, which is based on a levered beta of 0.800. Beta is a measure of a stock's volatility, compared to the market as a whole. We get our beta from the industry average beta of globally comparable companies, with an imposed limit between 0.8 and 2.0, which is a reasonable range for a stable business.
SWOT Analysis for Kimberly-Clark de México S. A. B. de C. V
Strength
- Earnings growth over the past year exceeded the industry.
- Debt is well covered by earnings and cashflows.
- Dividends are covered by earnings and cash flows.
Weakness
- Dividend is low compared to the top 25% of dividend payers in the Household Products market.
Opportunity
- Annual earnings are forecast to grow for the next 3 years.
- Trading below our estimate of fair value by more than 20%.
Threat
- Annual earnings are forecast to grow slower than the Mexican market.
Next Steps:
Valuation is only one side of the coin in terms of building your investment thesis, and it is only one of many factors that you need to assess for a company. It's not possible to obtain a foolproof valuation with a DCF model. Instead the best use for a DCF model is to test certain assumptions and theories to see if they would lead to the company being undervalued or overvalued. For instance, if the terminal value growth rate is adjusted slightly, it can dramatically alter the overall result. Can we work out why the company is trading at a discount to intrinsic value? For Kimberly-Clark de México S. A. B. de C. V, there are three fundamental aspects you should look at:
- Risks: Be aware that Kimberly-Clark de México S. A. B. de C. V is showing 2 warning signs in our investment analysis , you should know about...
- Future Earnings: How does KIMBER A's growth rate compare to its peers and the wider market? Dig deeper into the analyst consensus number for the upcoming years by interacting with our free analyst growth expectation chart.
- Other Solid Businesses: Low debt, high returns on equity and good past performance are fundamental to a strong business. Why not explore our interactive list of stocks with solid business fundamentals to see if there are other companies you may not have considered!
PS. Simply Wall St updates its DCF calculation for every Mexican stock every day, so if you want to find the intrinsic value of any other stock just search here.
Valuation is complex, but we're here to simplify it.
Discover if Kimberly-Clark de México S. A. B. de C. V might be undervalued or overvalued with our detailed analysis, featuring fair value estimates, potential risks, dividends, insider trades, and its financial condition.
Access Free AnalysisHave feedback on this article? Concerned about the content? Get in touch with us directly. Alternatively, email editorial-team (at) simplywallst.com.
This article by Simply Wall St is general in nature. We provide commentary based on historical data and analyst forecasts only using an unbiased methodology and our articles are not intended to be financial advice. It does not constitute a recommendation to buy or sell any stock, and does not take account of your objectives, or your financial situation. We aim to bring you long-term focused analysis driven by fundamental data. Note that our analysis may not factor in the latest price-sensitive company announcements or qualitative material. Simply Wall St has no position in any stocks mentioned.
Have feedback on this article? Concerned about the content? Get in touch with us directly. Alternatively, email editorial-team@simplywallst.com
About BMV:KIMBER A
Kimberly-Clark de México S. A. B. de C. V
Manufactures, distributes, and sells disposable products in Mexico.
Excellent balance sheet established dividend payer.
Similar Companies
Market Insights

Advertisement
Community Narratives
WhiteCap Is Positioned To Profit Regardless Of Trump's Policy 
Fair Value CA$22.60|61.6% undervalued
ST
Equity Analyst and Writer
Microsoft's Evolution Will Drive Revenue to New Heights Fueled by AI
Fair Value US$360.00|29.9% overvalued
BR
Community Contributor
A CASE FOR USD$2.50 (CAD$3.44) BY 2028 (A 5-10 BAGGER)
Fair Value CA$3.44|87.8% undervalued
AG
Community Contributor