Stock Analysis
Gruma, S.A.B. de C.V. (BMV:GRUMAB) Stock Has Shown Weakness Lately But Financials Look Strong: Should Prospective Shareholders Make The Leap?

Gruma. de (BMV:GRUMAB) has had a rough three months with its share price down 7.3%. But if you pay close attention, you might gather that its strong financials could mean that the stock could potentially see an increase in value in the long-term, given how markets usually reward companies with good financial health. Specifically, we decided to study Gruma. de's ROE in this article.
Return on equity or ROE is a key measure used to assess how efficiently a company's management is utilizing the company's capital. In short, ROE shows the profit each dollar generates with respect to its shareholder investments.
View our latest analysis for Gruma. de
How Do You Calculate Return On Equity?
ROE can be calculated by using the formula:
Return on Equity = Net Profit (from continuing operations) ÷ Shareholders' Equity
So, based on the above formula, the ROE for Gruma. de is:
22% = US$408m ÷ US$1.8b (Based on the trailing twelve months to December 2023).
The 'return' is the profit over the last twelve months. One way to conceptualize this is that for each MX$1 of shareholders' capital it has, the company made MX$0.22 in profit.
What Is The Relationship Between ROE And Earnings Growth?
Thus far, we have learned that ROE measures how efficiently a company is generating its profits. We now need to evaluate how much profit the company reinvests or "retains" for future growth which then gives us an idea about the growth potential of the company. Assuming everything else remains unchanged, the higher the ROE and profit retention, the higher the growth rate of a company compared to companies that don't necessarily bear these characteristics.
A Side By Side comparison of Gruma. de's Earnings Growth And 22% ROE
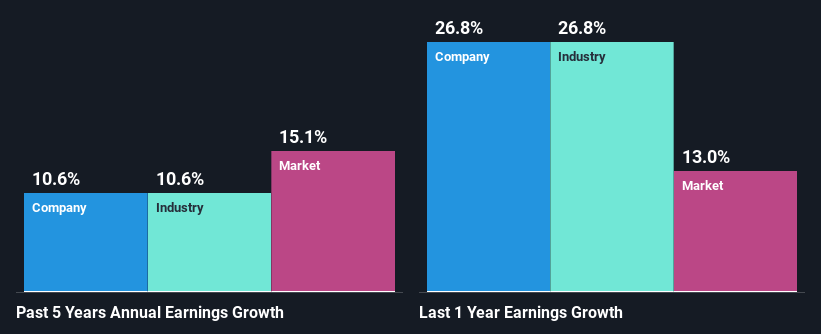
To start with, Gruma. de's ROE looks acceptable. Further, the company's ROE is similar to the industry average of 20%. Consequently, this likely laid the ground for the decent growth of 11% seen over the past five years by Gruma. de.
We then performed a comparison between Gruma. de's net income growth with the industry, which revealed that the company's growth is similar to the average industry growth of 11% in the same 5-year period.
Earnings growth is an important metric to consider when valuing a stock. The investor should try to establish if the expected growth or decline in earnings, whichever the case may be, is priced in. By doing so, they will have an idea if the stock is headed into clear blue waters or if swampy waters await. What is GRUMA B worth today? The intrinsic value infographic in our free research report helps visualize whether GRUMA B is currently mispriced by the market.
Is Gruma. de Efficiently Re-investing Its Profits?
Gruma. de has a three-year median payout ratio of 34%, which implies that it retains the remaining 66% of its profits. This suggests that its dividend is well covered, and given the decent growth seen by the company, it looks like management is reinvesting its earnings efficiently.
Besides, Gruma. de has been paying dividends for at least ten years or more. This shows that the company is committed to sharing profits with its shareholders. Existing analyst estimates suggest that the company's future payout ratio is expected to drop to 25% over the next three years. However, the company's ROE is not expected to change by much despite the lower expected payout ratio.
Conclusion
Overall, we are quite pleased with Gruma. de's performance. In particular, it's great to see that the company is investing heavily into its business and along with a high rate of return, that has resulted in a sizeable growth in its earnings. That being so, a study of the latest analyst forecasts show that the company is expected to see a slowdown in its future earnings growth. To know more about the latest analysts predictions for the company, check out this visualization of analyst forecasts for the company.
Valuation is complex, but we're helping make it simple.
Find out whether Gruma. de is potentially over or undervalued by checking out our comprehensive analysis, which includes fair value estimates, risks and warnings, dividends, insider transactions and financial health.
View the Free AnalysisHave feedback on this article? Concerned about the content? Get in touch with us directly. Alternatively, email editorial-team (at) simplywallst.com.
This article by Simply Wall St is general in nature. We provide commentary based on historical data and analyst forecasts only using an unbiased methodology and our articles are not intended to be financial advice. It does not constitute a recommendation to buy or sell any stock, and does not take account of your objectives, or your financial situation. We aim to bring you long-term focused analysis driven by fundamental data. Note that our analysis may not factor in the latest price-sensitive company announcements or qualitative material. Simply Wall St has no position in any stocks mentioned.
About BMV:GRUMA B
Gruma. de
Gruma, S.A.B. de C.V., together with its subsidiaries, produces and sells corn flour, tortillas, and other related products.
Solid track record with excellent balance sheet.
