
Advertisement
- Mexico
- /
- Oil and Gas
- /
- BMV:VISTA A
Is Vista Energy, S.A.B. de C.V. (BMV:VISTAA) Trading At A 32% Discount?

Key Insights
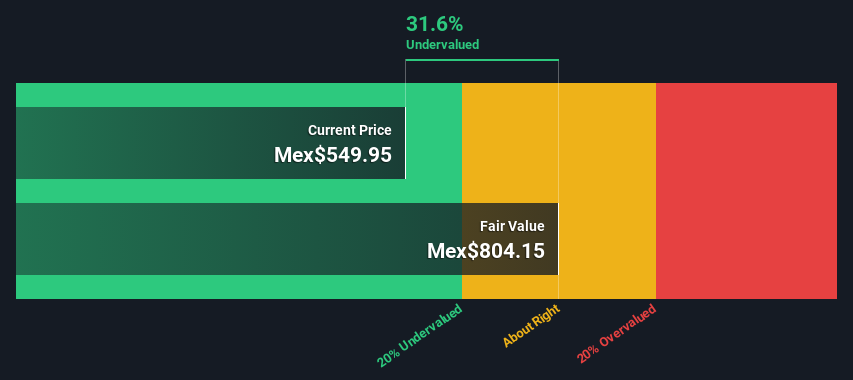
- Vista Energy. de's estimated fair value is Mex$804 based on 2 Stage Free Cash Flow to Equity
- Vista Energy. de's Mex$550 share price signals that it might be 32% undervalued
- The analyst price target for VISTA A is 100% less than our estimate of fair value
Today we will run through one way of estimating the intrinsic value of Vista Energy, S.A.B. de C.V. (BMV:VISTAA) by estimating the company's future cash flows and discounting them to their present value. We will use the Discounted Cash Flow (DCF) model on this occasion. There's really not all that much to it, even though it might appear quite complex.
Remember though, that there are many ways to estimate a company's value, and a DCF is just one method. For those who are keen learners of equity analysis, the Simply Wall St analysis model here may be something of interest to you.
See our latest analysis for Vista Energy. de
Step By Step Through The Calculation
We're using the 2-stage growth model, which simply means we take in account two stages of company's growth. In the initial period the company may have a higher growth rate and the second stage is usually assumed to have a stable growth rate. In the first stage we need to estimate the cash flows to the business over the next ten years. Where possible we use analyst estimates, but when these aren't available we extrapolate the previous free cash flow (FCF) from the last estimate or reported value. We assume companies with shrinking free cash flow will slow their rate of shrinkage, and that companies with growing free cash flow will see their growth rate slow, over this period. We do this to reflect that growth tends to slow more in the early years than it does in later years.
Generally we assume that a dollar today is more valuable than a dollar in the future, and so the sum of these future cash flows is then discounted to today's value:
10-year free cash flow (FCF) estimate
| 2024 | 2025 | 2026 | 2027 | 2028 | 2029 | 2030 | 2031 | 2032 | 2033 | |
| Levered FCF ($, Millions) | US$191.0m | US$332.0m | US$422.0m | US$496.7m | US$569.6m | US$641.3m | US$712.6m | US$784.6m | US$858.1m | US$934.1m |
| Growth Rate Estimate Source | Analyst x1 | Analyst x1 | Analyst x1 | Est @ 17.69% | Est @ 14.69% | Est @ 12.59% | Est @ 11.12% | Est @ 10.09% | Est @ 9.37% | Est @ 8.87% |
| Present Value ($, Millions) Discounted @ 17% | US$163 | US$241 | US$262 | US$263 | US$257 | US$247 | US$234 | US$219 | US$205 | US$190 |
("Est" = FCF growth rate estimated by Simply Wall St)
Present Value of 10-year Cash Flow (PVCF) = US$2.3b
After calculating the present value of future cash flows in the initial 10-year period, we need to calculate the Terminal Value, which accounts for all future cash flows beyond the first stage. For a number of reasons a very conservative growth rate is used that cannot exceed that of a country's GDP growth. In this case we have used the 5-year average of the 10-year government bond yield (7.7%) to estimate future growth. In the same way as with the 10-year 'growth' period, we discount future cash flows to today's value, using a cost of equity of 17%.
Terminal Value (TV)= FCF2033 × (1 + g) ÷ (r – g) = US$934m× (1 + 7.7%) ÷ (17%– 7.7%) = US$11b
Present Value of Terminal Value (PVTV)= TV / (1 + r)10= US$11b÷ ( 1 + 17%)10= US$2.1b
The total value, or equity value, is then the sum of the present value of the future cash flows, which in this case is US$4.4b. The last step is to then divide the equity value by the number of shares outstanding. Relative to the current share price of Mex$550, the company appears quite undervalued at a 32% discount to where the stock price trades currently. The assumptions in any calculation have a big impact on the valuation, so it is better to view this as a rough estimate, not precise down to the last cent.
Important Assumptions
We would point out that the most important inputs to a discounted cash flow are the discount rate and of course the actual cash flows. Part of investing is coming up with your own evaluation of a company's future performance, so try the calculation yourself and check your own assumptions. The DCF also does not consider the possible cyclicality of an industry, or a company's future capital requirements, so it does not give a full picture of a company's potential performance. Given that we are looking at Vista Energy. de as potential shareholders, the cost of equity is used as the discount rate, rather than the cost of capital (or weighted average cost of capital, WACC) which accounts for debt. In this calculation we've used 17%, which is based on a levered beta of 1.213. Beta is a measure of a stock's volatility, compared to the market as a whole. We get our beta from the industry average beta of globally comparable companies, with an imposed limit between 0.8 and 2.0, which is a reasonable range for a stable business.
SWOT Analysis for Vista Energy. de
Strength
- Earnings growth over the past year exceeded the industry.
- Debt is well covered by earnings and cashflows.
Weakness
- Earnings growth over the past year is below its 5-year average.
- Shareholders have been diluted in the past year.
Opportunity
- Annual earnings are forecast to grow faster than the Mexican market.
- Trading below our estimate of fair value by more than 20%.
Threat
- Revenue is forecast to grow slower than 20% per year.
Looking Ahead:
Whilst important, the DCF calculation is only one of many factors that you need to assess for a company. DCF models are not the be-all and end-all of investment valuation. Instead the best use for a DCF model is to test certain assumptions and theories to see if they would lead to the company being undervalued or overvalued. For instance, if the terminal value growth rate is adjusted slightly, it can dramatically alter the overall result. Why is the intrinsic value higher than the current share price? For Vista Energy. de, there are three important items you should consider:
- Risks: For example, we've discovered 4 warning signs for Vista Energy. de (2 are significant!) that you should be aware of before investing here.
- Future Earnings: How does VISTA A's growth rate compare to its peers and the wider market? Dig deeper into the analyst consensus number for the upcoming years by interacting with our free analyst growth expectation chart.
- Other Solid Businesses: Low debt, high returns on equity and good past performance are fundamental to a strong business. Why not explore our interactive list of stocks with solid business fundamentals to see if there are other companies you may not have considered!
PS. Simply Wall St updates its DCF calculation for every Mexican stock every day, so if you want to find the intrinsic value of any other stock just search here.
New: Manage All Your Stock Portfolios in One Place
We've created the ultimate portfolio companion for stock investors, and it's free.
• Connect an unlimited number of Portfolios and see your total in one currency
• Be alerted to new Warning Signs or Risks via email or mobile
• Track the Fair Value of your stocks
Have feedback on this article? Concerned about the content? Get in touch with us directly. Alternatively, email editorial-team (at) simplywallst.com.
This article by Simply Wall St is general in nature. We provide commentary based on historical data and analyst forecasts only using an unbiased methodology and our articles are not intended to be financial advice. It does not constitute a recommendation to buy or sell any stock, and does not take account of your objectives, or your financial situation. We aim to bring you long-term focused analysis driven by fundamental data. Note that our analysis may not factor in the latest price-sensitive company announcements or qualitative material. Simply Wall St has no position in any stocks mentioned.
About BMV:VISTA A
Vista Energy. de
Through its subsidiaries, engages in the exploration and production of oil and gas in Latin America.
Good value with moderate growth potential.
Similar Companies
Market Insights


Advertisement
Community Narratives
Alphabet: The Under-appreciated Compounder Hiding in Plain Sight
Fair Value US$282.83|31.8% undervalued
BL
Community Contributor
Planet Labs: At The Heart Of The Emerging New Space Boom
Fair Value US$11.31|44.7% undervalued
AN
Community Contributor
Exxon in Guyana 5 year forecast Low $135 to High $189
Fair Value US$189.00|40.9% undervalued
AG
Community Contributor