- South Korea
- /
- Telecom Services and Carriers
- /
- KOSDAQ:A093320
KINX's (KOSDAQ:093320) five-year total shareholder returns outpace the underlying earnings growth


While KINX, Inc. (KOSDAQ:093320) shareholders are probably generally happy, the stock hasn't had particularly good run recently, with the share price falling 22% in the last quarter. But that scarcely detracts from the really solid long term returns generated by the company over five years. It's fair to say most would be happy with 113% the gain in that time. We think it's more important to dwell on the long term returns than the short term returns. Ultimately business performance will determine whether the stock price continues the positive long term trend.
Since the long term performance has been good but there's been a recent pullback of 11%, let's check if the fundamentals match the share price.
See our latest analysis for KINX
To paraphrase Benjamin Graham: Over the short term the market is a voting machine, but over the long term it's a weighing machine. One imperfect but simple way to consider how the market perception of a company has shifted is to compare the change in the earnings per share (EPS) with the share price movement.
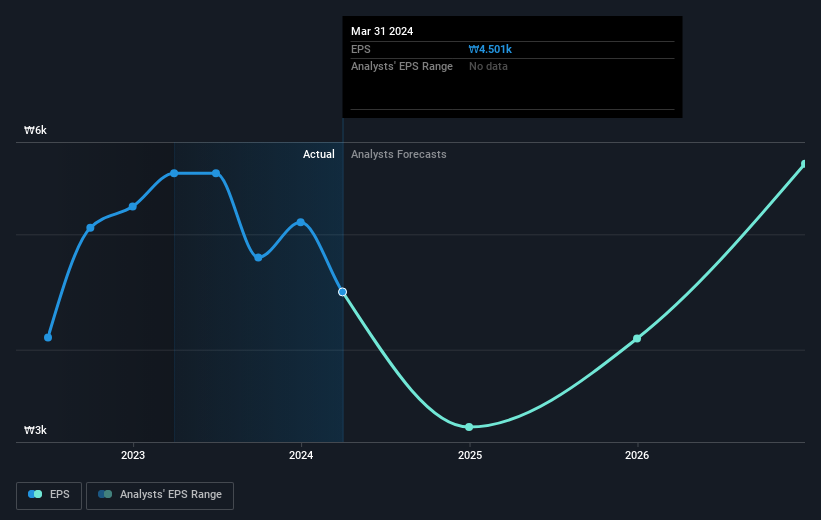
During five years of share price growth, KINX achieved compound earnings per share (EPS) growth of 8.6% per year. This EPS growth is slower than the share price growth of 16% per year, over the same period. This suggests that market participants hold the company in higher regard, these days. And that's hardly shocking given the track record of growth.
You can see below how EPS has changed over time (discover the exact values by clicking on the image).
Dive deeper into KINX's key metrics by checking this interactive graph of KINX's earnings, revenue and cash flow.
What About Dividends?
When looking at investment returns, it is important to consider the difference between total shareholder return (TSR) and share price return. The TSR is a return calculation that accounts for the value of cash dividends (assuming that any dividend received was reinvested) and the calculated value of any discounted capital raisings and spin-offs. It's fair to say that the TSR gives a more complete picture for stocks that pay a dividend. In the case of KINX, it has a TSR of 123% for the last 5 years. That exceeds its share price return that we previously mentioned. This is largely a result of its dividend payments!
A Different Perspective
It's good to see that KINX has rewarded shareholders with a total shareholder return of 9.9% in the last twelve months. That's including the dividend. However, the TSR over five years, coming in at 17% per year, is even more impressive. Potential buyers might understandably feel they've missed the opportunity, but it's always possible business is still firing on all cylinders. I find it very interesting to look at share price over the long term as a proxy for business performance. But to truly gain insight, we need to consider other information, too. For example, we've discovered 1 warning sign for KINX that you should be aware of before investing here.
Of course KINX may not be the best stock to buy. So you may wish to see this free collection of growth stocks.
Please note, the market returns quoted in this article reflect the market weighted average returns of stocks that currently trade on South Korean exchanges.
Valuation is complex, but we're here to simplify it.
Discover if KINX might be undervalued or overvalued with our detailed analysis, featuring fair value estimates, potential risks, dividends, insider trades, and its financial condition.
Access Free AnalysisHave feedback on this article? Concerned about the content? Get in touch with us directly. Alternatively, email editorial-team (at) simplywallst.com.
This article by Simply Wall St is general in nature. We provide commentary based on historical data and analyst forecasts only using an unbiased methodology and our articles are not intended to be financial advice. It does not constitute a recommendation to buy or sell any stock, and does not take account of your objectives, or your financial situation. We aim to bring you long-term focused analysis driven by fundamental data. Note that our analysis may not factor in the latest price-sensitive company announcements or qualitative material. Simply Wall St has no position in any stocks mentioned.
Have feedback on this article? Concerned about the content? Get in touch with us directly. Alternatively, email editorial-team@simplywallst.com
About KOSDAQ:A093320
KINX
Engages in the provision of Internet exchange (IX) services to various carriers, content providers, multiple system operators, financial institutions, and government agencies in South Korea and internationally.
Excellent balance sheet and fair value.
