
Advertisement
- South Korea
- /
- Electronic Equipment and Components
- /
- KOSE:A007660
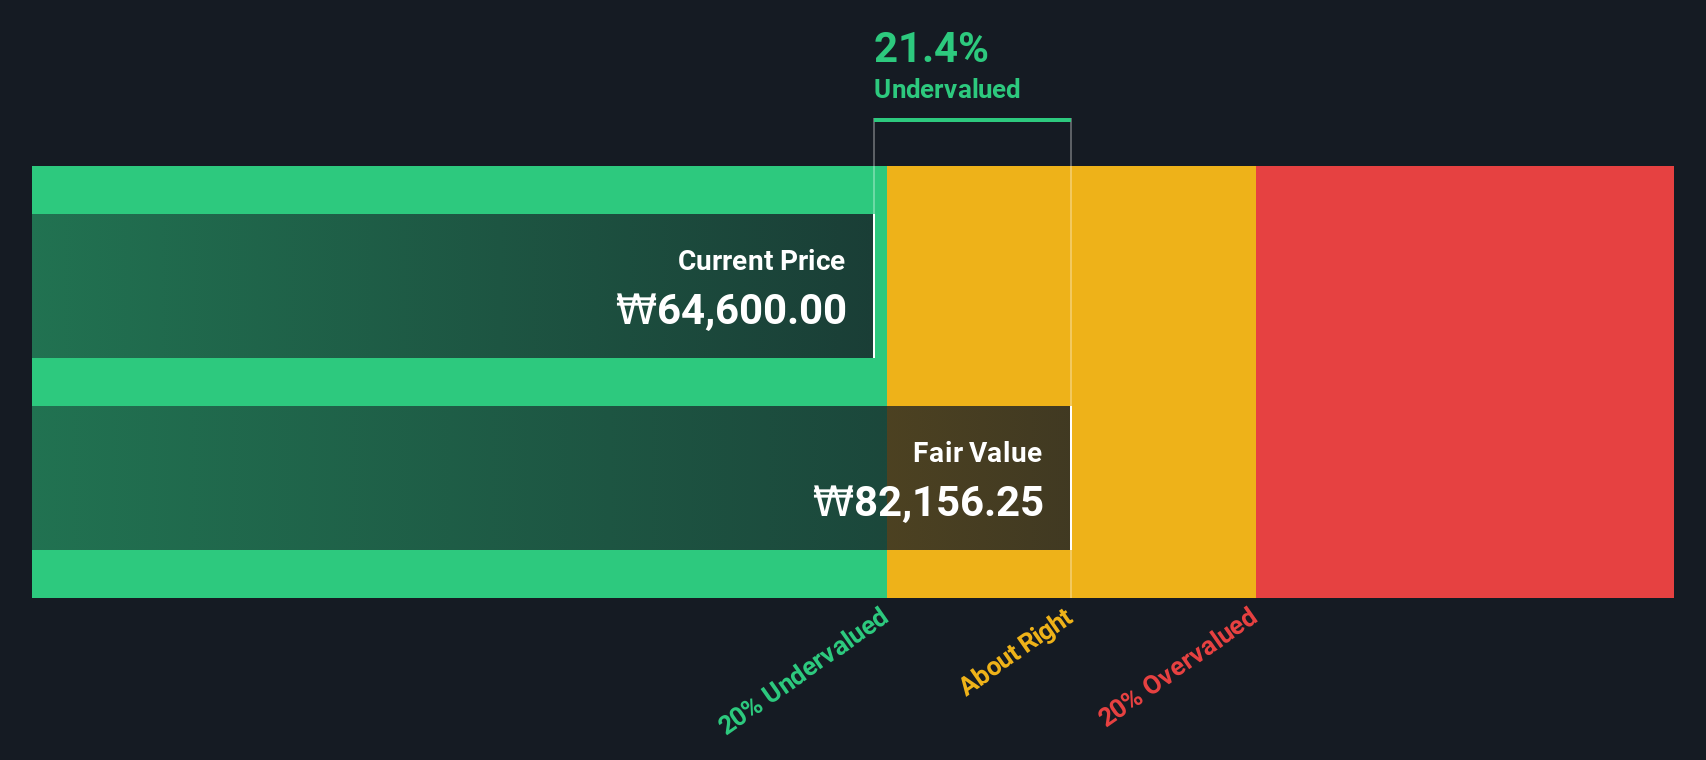
An Intrinsic Calculation For ISU Petasys Co., Ltd. (KRX:007660) Suggests It's 21% Undervalued
Key Insights
- The projected fair value for ISU Petasys is ₩82,156 based on 2 Stage Free Cash Flow to Equity
- Current share price of ₩64,600 suggests ISU Petasys is potentially 21% undervalued
- The ₩67,714 analyst price target for A007660 is 18% less than our estimate of fair value
Today we'll do a simple run through of a valuation method used to estimate the attractiveness of ISU Petasys Co., Ltd. (KRX:007660) as an investment opportunity by taking the forecast future cash flows of the company and discounting them back to today's value. One way to achieve this is by employing the Discounted Cash Flow (DCF) model. There's really not all that much to it, even though it might appear quite complex.
We generally believe that a company's value is the present value of all of the cash it will generate in the future. However, a DCF is just one valuation metric among many, and it is not without flaws. Anyone interested in learning a bit more about intrinsic value should have a read of the Simply Wall St analysis model.
The Calculation
We use what is known as a 2-stage model, which simply means we have two different periods of growth rates for the company's cash flows. Generally the first stage is higher growth, and the second stage is a lower growth phase. To begin with, we have to get estimates of the next ten years of cash flows. Where possible we use analyst estimates, but when these aren't available we extrapolate the previous free cash flow (FCF) from the last estimate or reported value. We assume companies with shrinking free cash flow will slow their rate of shrinkage, and that companies with growing free cash flow will see their growth rate slow, over this period. We do this to reflect that growth tends to slow more in the early years than it does in later years.
Generally we assume that a dollar today is more valuable than a dollar in the future, so we discount the value of these future cash flows to their estimated value in today's dollars:
10-year free cash flow (FCF) forecast
| 2026 | 2027 | 2028 | 2029 | 2030 | 2031 | 2032 | 2033 | 2034 | 2035 | |
| Levered FCF (₩, Millions) | ₩141.9b | ₩204.1b | ₩253.2b | ₩298.0b | ₩337.5b | ₩371.7b | ₩401.3b | ₩427.2b | ₩450.1b | ₩470.9b |
| Growth Rate Estimate Source | Analyst x3 | Analyst x3 | Est @ 24.04% | Est @ 17.69% | Est @ 13.25% | Est @ 10.14% | Est @ 7.96% | Est @ 6.44% | Est @ 5.37% | Est @ 4.62% |
| Present Value (₩, Millions) Discounted @ 8.4% | ₩131.0k | ₩173.9k | ₩199.1k | ₩216.2k | ₩226.0k | ₩229.8k | ₩228.9k | ₩224.9k | ₩218.7k | ₩211.2k |
("Est" = FCF growth rate estimated by Simply Wall St)
Present Value of 10-year Cash Flow (PVCF) = ₩2.1t
The second stage is also known as Terminal Value, this is the business's cash flow after the first stage. The Gordon Growth formula is used to calculate Terminal Value at a future annual growth rate equal to the 5-year average of the 10-year government bond yield of 2.9%. We discount the terminal cash flows to today's value at a cost of equity of 8.4%.
Terminal Value (TV)= FCF2035 × (1 + g) ÷ (r – g) = ₩471b× (1 + 2.9%) ÷ (8.4%– 2.9%) = ₩8.9t
Present Value of Terminal Value (PVTV)= TV / (1 + r)10= ₩8.9t÷ ( 1 + 8.4%)10= ₩4.0t
The total value is the sum of cash flows for the next ten years plus the discounted terminal value, which results in the Total Equity Value, which in this case is ₩6.0t. The last step is to then divide the equity value by the number of shares outstanding. Relative to the current share price of ₩65k, the company appears a touch undervalued at a 21% discount to where the stock price trades currently. Remember though, that this is just an approximate valuation, and like any complex formula - garbage in, garbage out.
Important Assumptions
Now the most important inputs to a discounted cash flow are the discount rate, and of course, the actual cash flows. If you don't agree with these result, have a go at the calculation yourself and play with the assumptions. The DCF also does not consider the possible cyclicality of an industry, or a company's future capital requirements, so it does not give a full picture of a company's potential performance. Given that we are looking at ISU Petasys as potential shareholders, the cost of equity is used as the discount rate, rather than the cost of capital (or weighted average cost of capital, WACC) which accounts for debt. In this calculation we've used 8.4%, which is based on a levered beta of 1.107. Beta is a measure of a stock's volatility, compared to the market as a whole. We get our beta from the industry average beta of globally comparable companies, with an imposed limit between 0.8 and 2.0, which is a reasonable range for a stable business.
See our latest analysis for ISU Petasys
SWOT Analysis for ISU Petasys
Strength
- Earnings growth over the past year exceeded the industry.
- Debt is well covered by earnings and cashflows.
Weakness
- Dividend is low compared to the top 25% of dividend payers in the Electronic market.
- Shareholders have been diluted in the past year.
Opportunity
- Annual earnings are forecast to grow faster than the South Korean market.
- Trading below our estimate of fair value by more than 20%.
Threat
- Revenue is forecast to grow slower than 20% per year.
Next Steps:
Although the valuation of a company is important, it shouldn't be the only metric you look at when researching a company. The DCF model is not a perfect stock valuation tool. Rather it should be seen as a guide to "what assumptions need to be true for this stock to be under/overvalued?" For example, changes in the company's cost of equity or the risk free rate can significantly impact the valuation. Why is the intrinsic value higher than the current share price? For ISU Petasys, there are three fundamental items you should further examine:
- Risks: Case in point, we've spotted 2 warning signs for ISU Petasys you should be aware of.
- Future Earnings: How does A007660's growth rate compare to its peers and the wider market? Dig deeper into the analyst consensus number for the upcoming years by interacting with our free analyst growth expectation chart.
- Other Solid Businesses: Low debt, high returns on equity and good past performance are fundamental to a strong business. Why not explore our interactive list of stocks with solid business fundamentals to see if there are other companies you may not have considered!
PS. The Simply Wall St app conducts a discounted cash flow valuation for every stock on the KOSE every day. If you want to find the calculation for other stocks just search here.
New: AI Stock Screener & Alerts
Our new AI Stock Screener scans the market every day to uncover opportunities.
• Dividend Powerhouses (3%+ Yield)
• Undervalued Small Caps with Insider Buying
• High growth Tech and AI Companies
Or build your own from over 50 metrics.
Have feedback on this article? Concerned about the content? Get in touch with us directly. Alternatively, email editorial-team (at) simplywallst.com.
This article by Simply Wall St is general in nature. We provide commentary based on historical data and analyst forecasts only using an unbiased methodology and our articles are not intended to be financial advice. It does not constitute a recommendation to buy or sell any stock, and does not take account of your objectives, or your financial situation. We aim to bring you long-term focused analysis driven by fundamental data. Note that our analysis may not factor in the latest price-sensitive company announcements or qualitative material. Simply Wall St has no position in any stocks mentioned.
About KOSE:A007660
ISU Petasys
Manufactures and sells printed circuit boards (PCBs) worldwide.
Exceptional growth potential with flawless balance sheet.
Similar Companies
Market Insights

Advertisement
Community Narratives
MicroVision will explode future revenue by 380.37% with a vision towards success
Fair Value US$60.00|98.4% undervalued
TH
Community Contributor
The Indispensable Artery for a New North American Economy
Fair Value CA$132.87|1.3% undervalued
TI
Community Contributor