- South Korea
- /
- Electronic Equipment and Components
- /
- KOSDAQ:A311320
Are GO Element Co., Ltd.'s (KOSDAQ:311320) Mixed Financials Driving The Negative Sentiment?

With its stock down 35% over the past three months, it is easy to disregard GO Element (KOSDAQ:311320). It seems that the market might have completely ignored the positive aspects of the company's fundamentals and decided to weigh-in more on the negative aspects. Long-term fundamentals are usually what drive market outcomes, so it's worth paying close attention. In this article, we decided to focus on GO Element's ROE.
ROE or return on equity is a useful tool to assess how effectively a company can generate returns on the investment it received from its shareholders. In simpler terms, it measures the profitability of a company in relation to shareholder's equity.
Check out our latest analysis for GO Element
How Do You Calculate Return On Equity?
ROE can be calculated by using the formula:
Return on Equity = Net Profit (from continuing operations) ÷ Shareholders' Equity
So, based on the above formula, the ROE for GO Element is:
5.3% = ₩2.7b ÷ ₩52b (Based on the trailing twelve months to March 2024).
The 'return' is the amount earned after tax over the last twelve months. That means that for every ₩1 worth of shareholders' equity, the company generated ₩0.05 in profit.
What Has ROE Got To Do With Earnings Growth?
Thus far, we have learned that ROE measures how efficiently a company is generating its profits. Based on how much of its profits the company chooses to reinvest or "retain", we are then able to evaluate a company's future ability to generate profits. Assuming everything else remains unchanged, the higher the ROE and profit retention, the higher the growth rate of a company compared to companies that don't necessarily bear these characteristics.
GO Element's Earnings Growth And 5.3% ROE
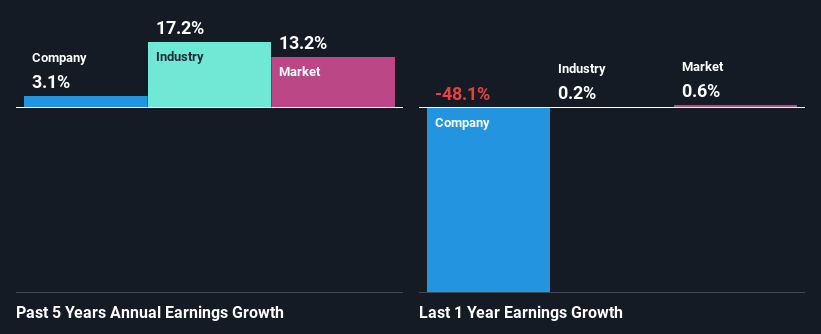
On the face of it, GO Element's ROE is not much to talk about. Next, when compared to the average industry ROE of 7.3%, the company's ROE leaves us feeling even less enthusiastic. As a result, GO Element reported a very low income growth of 3.1% over the past five years.
We then compared GO Element's net income growth with the industry and found that the company's growth figure is lower than the average industry growth rate of 17% in the same 5-year period, which is a bit concerning.
Earnings growth is an important metric to consider when valuing a stock. It’s important for an investor to know whether the market has priced in the company's expected earnings growth (or decline). Doing so will help them establish if the stock's future looks promising or ominous. One good indicator of expected earnings growth is the P/E ratio which determines the price the market is willing to pay for a stock based on its earnings prospects. So, you may want to check if GO Element is trading on a high P/E or a low P/E, relative to its industry.
Is GO Element Efficiently Re-investing Its Profits?
GO Element doesn't pay any regular dividends, which means that it is retaining all of its earnings. However, there's only been very little earnings growth to show for it. So there might be other factors at play here which could potentially be hampering growth. For example, the business has faced some headwinds.
Conclusion
Overall, we have mixed feelings about GO Element. While the company does have a high rate of profit retention, its low rate of return is probably hampering its earnings growth. Wrapping up, we would proceed with caution with this company and one way of doing that would be to look at the risk profile of the business. You can see the 3 risks we have identified for GO Element by visiting our risks dashboard for free on our platform here.
Mobile Infrastructure for Defense and Disaster
The next wave in robotics isn't humanoid. Its fully autonomous towers delivering 5G, ISR, and radar in under 30 minutes, anywhere.
Get the investor briefing before the next round of contracts
Sponsored On Behalf of CiTechNew: Manage All Your Stock Portfolios in One Place
We've created the ultimate portfolio companion for stock investors, and it's free.
• Connect an unlimited number of Portfolios and see your total in one currency
• Be alerted to new Warning Signs or Risks via email or mobile
• Track the Fair Value of your stocks
Have feedback on this article? Concerned about the content? Get in touch with us directly. Alternatively, email editorial-team (at) simplywallst.com.
This article by Simply Wall St is general in nature. We provide commentary based on historical data and analyst forecasts only using an unbiased methodology and our articles are not intended to be financial advice. It does not constitute a recommendation to buy or sell any stock, and does not take account of your objectives, or your financial situation. We aim to bring you long-term focused analysis driven by fundamental data. Note that our analysis may not factor in the latest price-sensitive company announcements or qualitative material. Simply Wall St has no position in any stocks mentioned.
About KOSDAQ:A311320
GO Element
Engages in the development, manufacture, and sales of semiconductor equipment and components.
Excellent balance sheet with slight risk.
Market Insights

Weekly Picks

Early mover in a fast growing industry. Likely to experience share price volatility as they scale


A case for CA$31.80 (undiluted), aka 8,616% upside from CA$0.37 (an 86 bagger!).


Moderation and Stabilisation: HOLD: Fair Price based on a 4-year Cycle is $12.08
Recently Updated Narratives

Airbnb Stock: Platform Growth in a World of Saturation and Scrutiny

Adobe Stock: AI-Fueled ARR Growth Pushes Guidance Higher, But Cost Pressures Loom

Thomson Reuters Stock: When Legal Intelligence Becomes Mission-Critical Infrastructure
Popular Narratives


Crazy Undervalued 42 Baggers Silver Play (Active & Running Mine)


NVDA: Expanding AI Demand Will Drive Major Data Center Investments Through 2026

The AI Infrastructure Giant Grows Into Its Valuation
Trending Discussion


