
Advertisement
- South Korea
- /
- Electronic Equipment and Components
- /
- KOSDAQ:A131400
EV Advanced Material Co.,Ltd's (KOSDAQ:131400) Popularity With Investors Under Threat As Stock Sinks 26%
EV Advanced Material Co.,Ltd (KOSDAQ:131400) shareholders that were waiting for something to happen have been dealt a blow with a 26% share price drop in the last month. The recent drop completes a disastrous twelve months for shareholders, who are sitting on a 77% loss during that time.
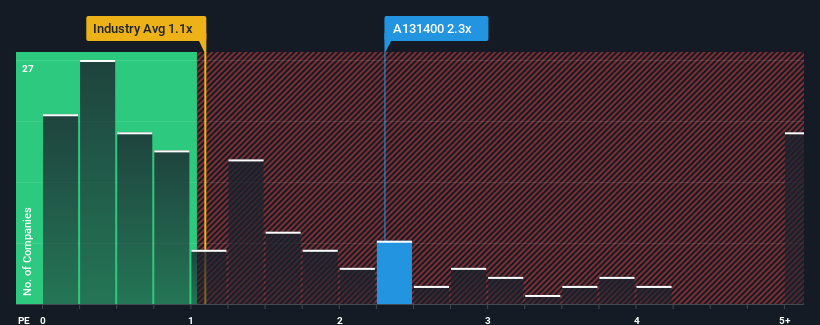
In spite of the heavy fall in price, you could still be forgiven for thinking EV Advanced MaterialLtd is a stock not worth researching with a price-to-sales ratios (or "P/S") of 2.3x, considering almost half the companies in Korea's Electronic industry have P/S ratios below 1.1x. However, the P/S might be high for a reason and it requires further investigation to determine if it's justified.
View our latest analysis for EV Advanced MaterialLtd
How EV Advanced MaterialLtd Has Been Performing
Revenue has risen firmly for EV Advanced MaterialLtd recently, which is pleasing to see. Perhaps the market is expecting this decent revenue performance to beat out the industry over the near term, which has kept the P/S propped up. If not, then existing shareholders may be a little nervous about the viability of the share price.
Although there are no analyst estimates available for EV Advanced MaterialLtd, take a look at this free data-rich visualisation to see how the company stacks up on earnings, revenue and cash flow.Do Revenue Forecasts Match The High P/S Ratio?
The only time you'd be truly comfortable seeing a P/S as high as EV Advanced MaterialLtd's is when the company's growth is on track to outshine the industry.
If we review the last year of revenue growth, the company posted a worthy increase of 8.1%. Pleasingly, revenue has also lifted 37% in aggregate from three years ago, partly thanks to the last 12 months of growth. So we can start by confirming that the company has done a great job of growing revenues over that time.
Comparing the recent medium-term revenue trends against the industry's one-year growth forecast of 14% shows it's noticeably less attractive.
With this in mind, we find it worrying that EV Advanced MaterialLtd's P/S exceeds that of its industry peers. It seems most investors are ignoring the fairly limited recent growth rates and are hoping for a turnaround in the company's business prospects. There's a good chance existing shareholders are setting themselves up for future disappointment if the P/S falls to levels more in line with recent growth rates.
What Does EV Advanced MaterialLtd's P/S Mean For Investors?
There's still some elevation in EV Advanced MaterialLtd's P/S, even if the same can't be said for its share price recently. We'd say the price-to-sales ratio's power isn't primarily as a valuation instrument but rather to gauge current investor sentiment and future expectations.
Our examination of EV Advanced MaterialLtd revealed its poor three-year revenue trends aren't detracting from the P/S as much as we though, given they look worse than current industry expectations. When we observe slower-than-industry revenue growth alongside a high P/S ratio, we assume there to be a significant risk of the share price decreasing, which would result in a lower P/S ratio. Unless the recent medium-term conditions improve markedly, it's very challenging to accept these the share price as being reasonable.
It's always necessary to consider the ever-present spectre of investment risk. We've identified 2 warning signs with EV Advanced MaterialLtd, and understanding them should be part of your investment process.
If strong companies turning a profit tickle your fancy, then you'll want to check out this free list of interesting companies that trade on a low P/E (but have proven they can grow earnings).
Valuation is complex, but we're here to simplify it.
Discover if EV Advanced MaterialLtd might be undervalued or overvalued with our detailed analysis, featuring fair value estimates, potential risks, dividends, insider trades, and its financial condition.
Access Free AnalysisHave feedback on this article? Concerned about the content? Get in touch with us directly. Alternatively, email editorial-team (at) simplywallst.com.
This article by Simply Wall St is general in nature. We provide commentary based on historical data and analyst forecasts only using an unbiased methodology and our articles are not intended to be financial advice. It does not constitute a recommendation to buy or sell any stock, and does not take account of your objectives, or your financial situation. We aim to bring you long-term focused analysis driven by fundamental data. Note that our analysis may not factor in the latest price-sensitive company announcements or qualitative material. Simply Wall St has no position in any stocks mentioned.
About KOSDAQ:A131400
EV Advanced MaterialLtd
Engages in the manufacture and sale of flexible printed circuit boards (FPCBs) in South Korea.
Flawless balance sheet with low risk.
Market Insights

Advertisement
Weekly Picks
WO

woodworthfund on MGP Ingredients ·
THE KINGDOM OF BROWN GOODS: WHY MGPI IS BEING CRUSHED BY INVENTORY & PRIMED FOR RESURRECTION
Fair Value:US$4034.1% undervalued
19 followersusers have followed this narrative
1 commentusers have commented on this narrative
5 likesusers have liked this narrative
DO


Double_Bubbler on Vertical Aerospace ·
Why Vertical Aerospace (NYSE: EVTL) is Worth Possibly Over 13x its Current Price
Fair Value:US$6090.0% undervalued
21 followersusers have followed this narrative
2 commentsusers have commented on this narrative
17 likesusers have liked this narrative
TI


TickerTickle on Oracle ·
The Quiet Giant That Became AI’s Power Grid
Fair Value:US$389.8142.8% undervalued
41 followersusers have followed this narrative
3 commentsusers have commented on this narrative
8 likesusers have liked this narrative
Recently Updated Narratives
MH


mhbb on Mastersystem Infotama ·
Mastersystem Infotama will achieve 18.9% revenue growth as fair value hits IDR1,650
Fair Value:Rp1.63k13.8% undervalued
1 followerusers have followed this narrative
0 commentsusers have commented on this narrative
0 likesusers have liked this narrative
RO


Robbo on Procter & Gamble ·
Insiders Sell, Investors Watch: What’s Going On at PG?
Fair Value:US$1506.8% undervalued
1 followerusers have followed this narrative
0 commentsusers have commented on this narrative
0 likesusers have liked this narrative
CW

Cwburton on Verano Holdings ·
Waiting for the Inevitable
Fair Value:CA$5.5278.8% undervalued
2 followersusers have followed this narrative
0 commentsusers have commented on this narrative
0 likesusers have liked this narrative
Popular Narratives
TH


TheWallstreetKing on MicroVision ·
MicroVision will explode future revenue by 380.37% with a vision towards success
Fair Value:US$6098.5% undervalued
119 followersusers have followed this narrative
11 commentsusers have commented on this narrative
22 likesusers have liked this narrative
AN


AnalystConsensusTarget on NVIDIA ·
NVDA: Expanding AI Demand Will Drive Major Data Center Investments Through 2026
Fair Value:US$250.3926.6% undervalued
962 followersusers have followed this narrative
6 commentsusers have commented on this narrative
25 likesusers have liked this narrative
RO


RockeTeller on Santacruz Silver Mining ·
Crazy Undervalued 42 Baggers Silver Play (Active & Running Mine)
Fair Value:CA$8684.3% undervalued
77 followersusers have followed this narrative
8 commentsusers have commented on this narrative
21 likesusers have liked this narrative
Trending Discussion

OI


OilStates on Oil States International ·
The article’s takeaways do not reflect Oil States’ current business mix or market realities. Nearly 75% of Company revenues now come from offshore and international projects, where industry investment is strengthening, not declining, and backlog is at the highest level in a decade. Oil States has intentionally exited lower-margin U.S. land markets, resulting in expanding margins, strong free cash flow, and a near-zero net-debt profile. Our offerings are concentrated in high-barrier, engineered offshore technologies where competitive pressure and regulatory risk are far lower than implied. These fundamentals therefore do not align with the structural-decline narrative presented. Find out more about the strong offshore/international, cash generation, and valuation upside potential in our latest investor presentation available here: https://ir.oilstatesintl.com/events-and-presentations/default.aspx
0
|0