- South Korea
- /
- Electronic Equipment and Components
- /
- KOSDAQ:A094970
JMT Co.,Ltd. (KOSDAQ:094970) Soars 27% But It's A Story Of Risk Vs Reward

Despite an already strong run, JMT Co.,Ltd. (KOSDAQ:094970) shares have been powering on, with a gain of 27% in the last thirty days. The last 30 days bring the annual gain to a very sharp 62%.
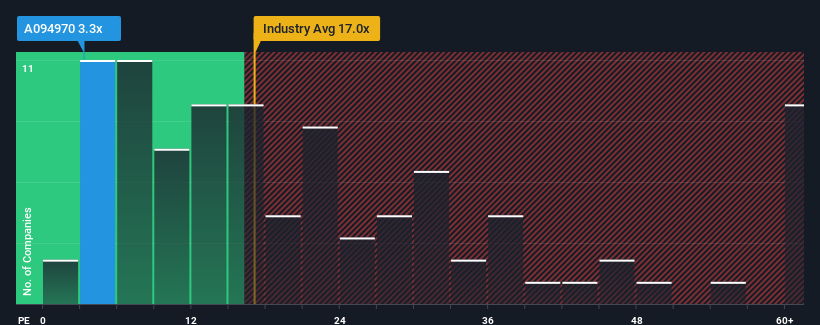
Although its price has surged higher, JMTLtd may still be sending very bullish signals at the moment with its price-to-earnings (or "P/E") ratio of 3.3x, since almost half of all companies in Korea have P/E ratios greater than 15x and even P/E's higher than 31x are not unusual. Although, it's not wise to just take the P/E at face value as there may be an explanation why it's so limited.
With earnings growth that's exceedingly strong of late, JMTLtd has been doing very well. It might be that many expect the strong earnings performance to degrade substantially, which has repressed the P/E. If you like the company, you'd be hoping this isn't the case so that you could potentially pick up some stock while it's out of favour.
View our latest analysis for JMTLtd
What Are Growth Metrics Telling Us About The Low P/E?
In order to justify its P/E ratio, JMTLtd would need to produce anemic growth that's substantially trailing the market.
Retrospectively, the last year delivered an exceptional 69% gain to the company's bottom line. Pleasingly, EPS has also lifted 6,926% in aggregate from three years ago, thanks to the last 12 months of growth. Therefore, it's fair to say the earnings growth recently has been superb for the company.
Comparing that to the market, which is only predicted to deliver 37% growth in the next 12 months, the company's momentum is stronger based on recent medium-term annualised earnings results.
In light of this, it's peculiar that JMTLtd's P/E sits below the majority of other companies. Apparently some shareholders believe the recent performance has exceeded its limits and have been accepting significantly lower selling prices.
What We Can Learn From JMTLtd's P/E?
Even after such a strong price move, JMTLtd's P/E still trails the rest of the market significantly. Using the price-to-earnings ratio alone to determine if you should sell your stock isn't sensible, however it can be a practical guide to the company's future prospects.
We've established that JMTLtd currently trades on a much lower than expected P/E since its recent three-year growth is higher than the wider market forecast. When we see strong earnings with faster-than-market growth, we assume potential risks are what might be placing significant pressure on the P/E ratio. It appears many are indeed anticipating earnings instability, because the persistence of these recent medium-term conditions would normally provide a boost to the share price.
It's always necessary to consider the ever-present spectre of investment risk. We've identified 3 warning signs with JMTLtd, and understanding these should be part of your investment process.
Of course, you might find a fantastic investment by looking at a few good candidates. So take a peek at this free list of companies with a strong growth track record, trading on a low P/E.
The New Payments ETF Is Live on NASDAQ:
Money is moving to real-time rails, and a newly listed ETF now gives investors direct exposure. Fast settlement. Institutional custody. Simple access.
Explore how this launch could reshape portfolios
Sponsored ContentNew: Manage All Your Stock Portfolios in One Place
We've created the ultimate portfolio companion for stock investors, and it's free.
• Connect an unlimited number of Portfolios and see your total in one currency
• Be alerted to new Warning Signs or Risks via email or mobile
• Track the Fair Value of your stocks
Have feedback on this article? Concerned about the content? Get in touch with us directly. Alternatively, email editorial-team (at) simplywallst.com.
This article by Simply Wall St is general in nature. We provide commentary based on historical data and analyst forecasts only using an unbiased methodology and our articles are not intended to be financial advice. It does not constitute a recommendation to buy or sell any stock, and does not take account of your objectives, or your financial situation. We aim to bring you long-term focused analysis driven by fundamental data. Note that our analysis may not factor in the latest price-sensitive company announcements or qualitative material. Simply Wall St has no position in any stocks mentioned.
About KOSDAQ:A094970
JMTLtd
Engages in the general electronic manufacturing services business in the information-communication field in South Korea and internationally.
Flawless balance sheet and slightly overvalued.
Market Insights

Weekly Picks

Early mover in a fast growing industry. Likely to experience share price volatility as they scale


A case for CA$31.80 (undiluted), aka 8,616% upside from CA$0.37 (an 86 bagger!).


Moderation and Stabilisation: HOLD: Fair Price based on a 4-year Cycle is $12.08
Recently Updated Narratives


Q3 Outlook modestly optimistic


Title: Market Sentiment Is Dead Wrong — Here's Why PSEC Deserves a Second Look


An amazing opportunity to potentially get a 100 bagger
Popular Narratives


Crazy Undervalued 42 Baggers Silver Play (Active & Running Mine)


NVDA: Expanding AI Demand Will Drive Major Data Center Investments Through 2026


MicroVision will explode future revenue by 380.37% with a vision towards success
Trending Discussion
