Stock Analysis
- South Korea
- /
- Electronic Equipment and Components
- /
- KOSDAQ:A091120
EM-Tech.CO (KOSDAQ:091120) delivers shareholders stellar 23% CAGR over 5 years, surging 16% in the last week alone


When you buy a stock there is always a possibility that it could drop 100%. But on the bright side, you can make far more than 100% on a really good stock. Long term EM-Tech.CO., LTD. (KOSDAQ:091120) shareholders would be well aware of this, since the stock is up 169% in five years. It's even up 16% in the last week.
The past week has proven to be lucrative for EM-Tech.CO investors, so let's see if fundamentals drove the company's five-year performance.
See our latest analysis for EM-Tech.CO
While the efficient markets hypothesis continues to be taught by some, it has been proven that markets are over-reactive dynamic systems, and investors are not always rational. One imperfect but simple way to consider how the market perception of a company has shifted is to compare the change in the earnings per share (EPS) with the share price movement.
EM-Tech.CO's earnings per share are down 0.9% per year, despite strong share price performance over five years.
By glancing at these numbers, we'd posit that the decline in earnings per share is not representative of how the business has changed over the years. Since the change in EPS doesn't seem to correlate with the change in share price, it's worth taking a look at other metrics.
We doubt the modest 0.3% dividend yield is attracting many buyers to the stock. In contrast revenue growth of 3.4% per year is probably viewed as evidence that EM-Tech.CO is growing, a real positive. It's quite possible that management are prioritizing revenue growth over EPS growth at the moment.
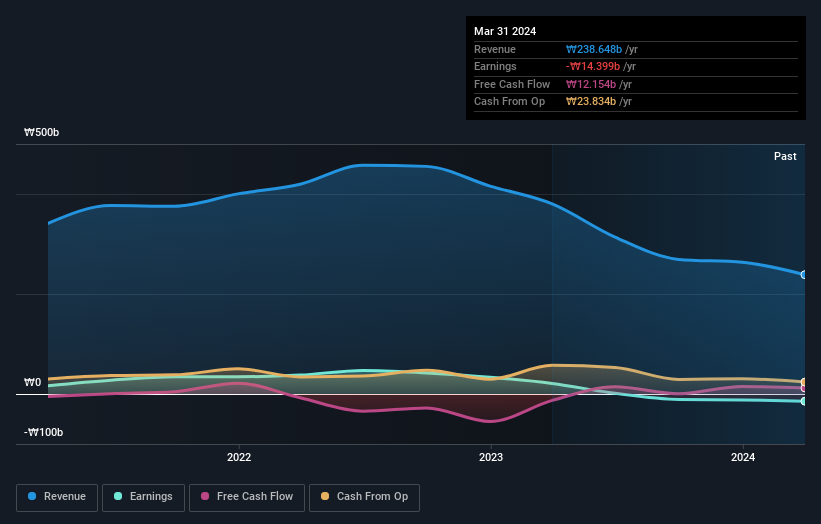
The company's revenue and earnings (over time) are depicted in the image below (click to see the exact numbers).
You can see how its balance sheet has strengthened (or weakened) over time in this free interactive graphic.
What About Dividends?
It is important to consider the total shareholder return, as well as the share price return, for any given stock. The TSR incorporates the value of any spin-offs or discounted capital raisings, along with any dividends, based on the assumption that the dividends are reinvested. So for companies that pay a generous dividend, the TSR is often a lot higher than the share price return. We note that for EM-Tech.CO the TSR over the last 5 years was 184%, which is better than the share price return mentioned above. The dividends paid by the company have thusly boosted the total shareholder return.
A Different Perspective
EM-Tech.CO shareholders are down 21% for the year (even including dividends), but the market itself is up 4.1%. However, keep in mind that even the best stocks will sometimes underperform the market over a twelve month period. On the bright side, long term shareholders have made money, with a gain of 23% per year over half a decade. It could be that the recent sell-off is an opportunity, so it may be worth checking the fundamental data for signs of a long term growth trend. While it is well worth considering the different impacts that market conditions can have on the share price, there are other factors that are even more important. For example, we've discovered 2 warning signs for EM-Tech.CO (1 is a bit unpleasant!) that you should be aware of before investing here.
Of course EM-Tech.CO may not be the best stock to buy. So you may wish to see this free collection of growth stocks.
Please note, the market returns quoted in this article reflect the market weighted average returns of stocks that currently trade on South Korean exchanges.
Valuation is complex, but we're here to simplify it.
Discover if EM-Tech.CO might be undervalued or overvalued with our detailed analysis, featuring fair value estimates, potential risks, dividends, insider trades, and its financial condition.
Access Free AnalysisHave feedback on this article? Concerned about the content? Get in touch with us directly. Alternatively, email editorial-team (at) simplywallst.com.
This article by Simply Wall St is general in nature. We provide commentary based on historical data and analyst forecasts only using an unbiased methodology and our articles are not intended to be financial advice. It does not constitute a recommendation to buy or sell any stock, and does not take account of your objectives, or your financial situation. We aim to bring you long-term focused analysis driven by fundamental data. Note that our analysis may not factor in the latest price-sensitive company announcements or qualitative material. Simply Wall St has no position in any stocks mentioned.
Have feedback on this article? Concerned about the content? Get in touch with us directly. Alternatively, email editorial-team@simplywallst.com
About KOSDAQ:A091120
EM-Tech.CO
Engages in the development, manufacture, and sale of microphones in South Korea.
Mediocre balance sheet very low.
