- South Korea
- /
- Electrical
- /
- KOSE:A000500
GAON CABLE Co., Ltd.'s (KRX:000500) Stock Has Shown Weakness Lately But Financial Prospects Look Decent: Is The Market Wrong?


It is hard to get excited after looking at GAON CABLE's (KRX:000500) recent performance, when its stock has declined 14% over the past month. However, stock prices are usually driven by a company’s financials over the long term, which in this case look pretty respectable. Specifically, we decided to study GAON CABLE's ROE in this article.
Return on equity or ROE is an important factor to be considered by a shareholder because it tells them how effectively their capital is being reinvested. In simpler terms, it measures the profitability of a company in relation to shareholder's equity.
Check out our latest analysis for GAON CABLE
How Is ROE Calculated?
The formula for ROE is:
Return on Equity = Net Profit (from continuing operations) ÷ Shareholders' Equity
So, based on the above formula, the ROE for GAON CABLE is:
5.3% = ₩18b ÷ ₩343b (Based on the trailing twelve months to March 2024).
The 'return' is the profit over the last twelve months. One way to conceptualize this is that for each ₩1 of shareholders' capital it has, the company made ₩0.05 in profit.
What Has ROE Got To Do With Earnings Growth?
We have already established that ROE serves as an efficient profit-generating gauge for a company's future earnings. Based on how much of its profits the company chooses to reinvest or "retain", we are then able to evaluate a company's future ability to generate profits. Generally speaking, other things being equal, firms with a high return on equity and profit retention, have a higher growth rate than firms that don’t share these attributes.
GAON CABLE's Earnings Growth And 5.3% ROE
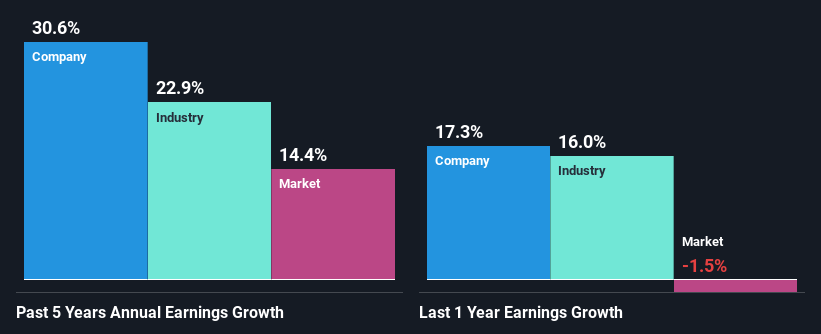
When you first look at it, GAON CABLE's ROE doesn't look that attractive. A quick further study shows that the company's ROE doesn't compare favorably to the industry average of 7.5% either. Despite this, surprisingly, GAON CABLE saw an exceptional 31% net income growth over the past five years. Therefore, there could be other reasons behind this growth. For example, it is possible that the company's management has made some good strategic decisions, or that the company has a low payout ratio.
Next, on comparing with the industry net income growth, we found that GAON CABLE's growth is quite high when compared to the industry average growth of 23% in the same period, which is great to see.
Earnings growth is an important metric to consider when valuing a stock. What investors need to determine next is if the expected earnings growth, or the lack of it, is already built into the share price. This then helps them determine if the stock is placed for a bright or bleak future. One good indicator of expected earnings growth is the P/E ratio which determines the price the market is willing to pay for a stock based on its earnings prospects. So, you may want to check if GAON CABLE is trading on a high P/E or a low P/E, relative to its industry.
Is GAON CABLE Making Efficient Use Of Its Profits?
GAON CABLE's three-year median payout ratio to shareholders is 14%, which is quite low. This implies that the company is retaining 86% of its profits. So it seems like the management is reinvesting profits heavily to grow its business and this reflects in its earnings growth number.
Moreover, GAON CABLE is determined to keep sharing its profits with shareholders which we infer from its long history of five years of paying a dividend.
Conclusion
On the whole, we do feel that GAON CABLE has some positive attributes. With a high rate of reinvestment, albeit at a low ROE, the company has managed to see a considerable growth in its earnings. While we won't completely dismiss the company, what we would do, is try to ascertain how risky the business is to make a more informed decision around the company. You can see the 2 risks we have identified for GAON CABLE by visiting our risks dashboard for free on our platform here.
New: Manage All Your Stock Portfolios in One Place
We've created the ultimate portfolio companion for stock investors, and it's free.
• Connect an unlimited number of Portfolios and see your total in one currency
• Be alerted to new Warning Signs or Risks via email or mobile
• Track the Fair Value of your stocks
Have feedback on this article? Concerned about the content? Get in touch with us directly. Alternatively, email editorial-team (at) simplywallst.com.
This article by Simply Wall St is general in nature. We provide commentary based on historical data and analyst forecasts only using an unbiased methodology and our articles are not intended to be financial advice. It does not constitute a recommendation to buy or sell any stock, and does not take account of your objectives, or your financial situation. We aim to bring you long-term focused analysis driven by fundamental data. Note that our analysis may not factor in the latest price-sensitive company announcements or qualitative material. Simply Wall St has no position in any stocks mentioned.
Have feedback on this article? Concerned about the content? Get in touch with us directly. Alternatively, email editorial-team@simplywallst.com
About KOSE:A000500
GAON CABLE
A cable company, provides industrial power cables in South Korea.
Adequate balance sheet low.

