- South Korea
- /
- Electronic Equipment and Components
- /
- KOSDAQ:A085670
NewFlex Technology Co., Ltd. (KOSDAQ:085670) Not Doing Enough For Some Investors As Its Shares Slump 31%

Unfortunately for some shareholders, the NewFlex Technology Co., Ltd. (KOSDAQ:085670) share price has dived 31% in the last thirty days, prolonging recent pain. Instead of being rewarded, shareholders who have already held through the last twelve months are now sitting on a 19% share price drop.
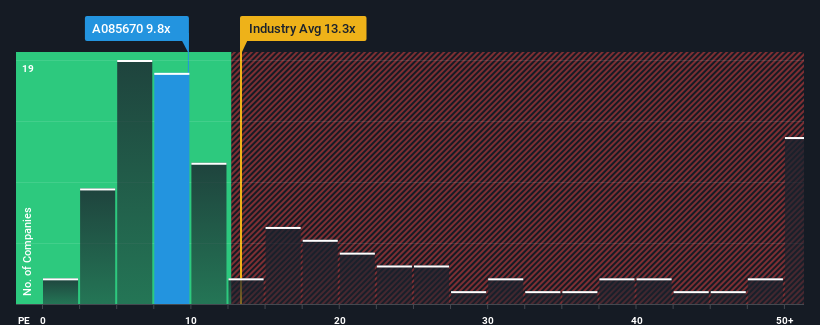
Although its price has dipped substantially, NewFlex Technology may still be sending bullish signals at the moment with its price-to-earnings (or "P/E") ratio of 9.8x, since almost half of all companies in Korea have P/E ratios greater than 12x and even P/E's higher than 25x are not unusual. However, the P/E might be low for a reason and it requires further investigation to determine if it's justified.
NewFlex Technology has been doing a good job lately as it's been growing earnings at a solid pace. One possibility is that the P/E is low because investors think this respectable earnings growth might actually underperform the broader market in the near future. If that doesn't eventuate, then existing shareholders have reason to be optimistic about the future direction of the share price.
View our latest analysis for NewFlex Technology
What Are Growth Metrics Telling Us About The Low P/E?
There's an inherent assumption that a company should underperform the market for P/E ratios like NewFlex Technology's to be considered reasonable.
If we review the last year of earnings growth, the company posted a worthy increase of 15%. Although, the latest three year period in total hasn't been as good as it didn't manage to provide any growth at all. Therefore, it's fair to say that earnings growth has been inconsistent recently for the company.
Comparing that to the market, which is predicted to deliver 31% growth in the next 12 months, the company's momentum is weaker based on recent medium-term annualised earnings results.
In light of this, it's understandable that NewFlex Technology's P/E sits below the majority of other companies. It seems most investors are expecting to see the recent limited growth rates continue into the future and are only willing to pay a reduced amount for the stock.
What We Can Learn From NewFlex Technology's P/E?
NewFlex Technology's P/E has taken a tumble along with its share price. Typically, we'd caution against reading too much into price-to-earnings ratios when settling on investment decisions, though it can reveal plenty about what other market participants think about the company.
We've established that NewFlex Technology maintains its low P/E on the weakness of its recent three-year growth being lower than the wider market forecast, as expected. At this stage investors feel the potential for an improvement in earnings isn't great enough to justify a higher P/E ratio. If recent medium-term earnings trends continue, it's hard to see the share price rising strongly in the near future under these circumstances.
Having said that, be aware NewFlex Technology is showing 1 warning sign in our investment analysis, you should know about.
Of course, you might also be able to find a better stock than NewFlex Technology. So you may wish to see this free collection of other companies that have reasonable P/E ratios and have grown earnings strongly.
The New Payments ETF Is Live on NASDAQ:
Money is moving to real-time rails, and a newly listed ETF now gives investors direct exposure. Fast settlement. Institutional custody. Simple access.
Explore how this launch could reshape portfolios
Sponsored ContentValuation is complex, but we're here to simplify it.
Discover if NewFlex Technology might be undervalued or overvalued with our detailed analysis, featuring fair value estimates, potential risks, dividends, insider trades, and its financial condition.
Access Free AnalysisHave feedback on this article? Concerned about the content? Get in touch with us directly. Alternatively, email editorial-team (at) simplywallst.com.
This article by Simply Wall St is general in nature. We provide commentary based on historical data and analyst forecasts only using an unbiased methodology and our articles are not intended to be financial advice. It does not constitute a recommendation to buy or sell any stock, and does not take account of your objectives, or your financial situation. We aim to bring you long-term focused analysis driven by fundamental data. Note that our analysis may not factor in the latest price-sensitive company announcements or qualitative material. Simply Wall St has no position in any stocks mentioned.
Have feedback on this article? Concerned about the content? Get in touch with us directly. Alternatively, email editorial-team@simplywallst.com
About KOSDAQ:A085670
NewFlex Technology
Engages in the manufacture and sale of flexible printed circuit boards products in South Korea.
Flawless balance sheet and slightly overvalued.
Market Insights

Weekly Picks

Early mover in a fast growing industry. Likely to experience share price volatility as they scale


A case for CA$31.80 (undiluted), aka 8,616% upside from CA$0.37 (an 86 bagger!).


Moderation and Stabilisation: HOLD: Fair Price based on a 4-year Cycle is $12.08
Recently Updated Narratives

Airbnb Stock: Platform Growth in a World of Saturation and Scrutiny

Adobe Stock: AI-Fueled ARR Growth Pushes Guidance Higher, But Cost Pressures Loom

Thomson Reuters Stock: When Legal Intelligence Becomes Mission-Critical Infrastructure
Popular Narratives


Crazy Undervalued 42 Baggers Silver Play (Active & Running Mine)


NVDA: Expanding AI Demand Will Drive Major Data Center Investments Through 2026

The AI Infrastructure Giant Grows Into Its Valuation
Trending Discussion


