
Advertisement
David Iben put it well when he said, 'Volatility is not a risk we care about. What we care about is avoiding the permanent loss of capital.' When we think about how risky a company is, we always like to look at its use of debt, since debt overload can lead to ruin. As with many other companies Frtek Co.Ltd. (KOSDAQ:073540) makes use of debt. But is this debt a concern to shareholders?
What Risk Does Debt Bring?
Debt and other liabilities become risky for a business when it cannot easily fulfill those obligations, either with free cash flow or by raising capital at an attractive price. If things get really bad, the lenders can take control of the business. However, a more common (but still painful) scenario is that it has to raise new equity capital at a low price, thus permanently diluting shareholders. Of course, the upside of debt is that it often represents cheap capital, especially when it replaces dilution in a company with the ability to reinvest at high rates of return. The first thing to do when considering how much debt a business uses is to look at its cash and debt together.
View our latest analysis for FrtekLtd
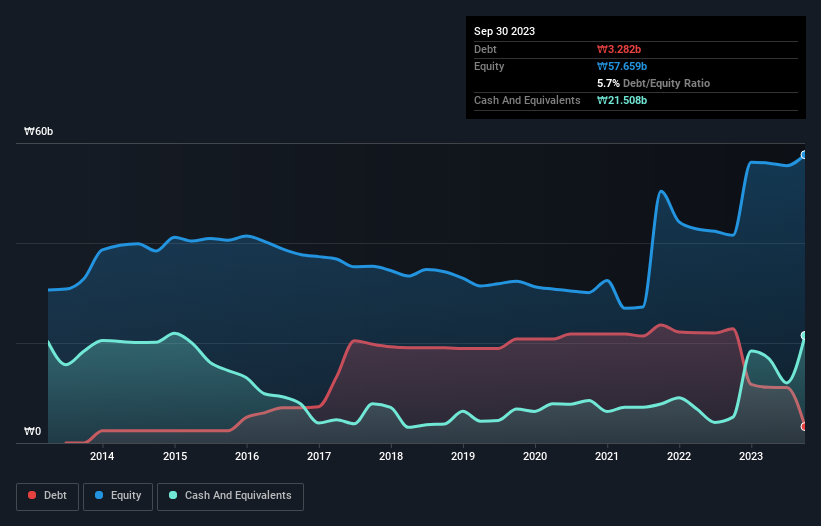
What Is FrtekLtd's Net Debt?
As you can see below, FrtekLtd had ₩3.28b of debt at September 2023, down from ₩22.9b a year prior. But on the other hand it also has ₩21.5b in cash, leading to a ₩18.2b net cash position.
A Look At FrtekLtd's Liabilities
According to the last reported balance sheet, FrtekLtd had liabilities of ₩13.2b due within 12 months, and liabilities of ₩7.50b due beyond 12 months. On the other hand, it had cash of ₩21.5b and ₩3.60b worth of receivables due within a year. So it actually has ₩4.44b more liquid assets than total liabilities.
It's good to see that FrtekLtd has plenty of liquidity on its balance sheet, suggesting conservative management of liabilities. Due to its strong net asset position, it is not likely to face issues with its lenders. Simply put, the fact that FrtekLtd has more cash than debt is arguably a good indication that it can manage its debt safely. There's no doubt that we learn most about debt from the balance sheet. But it is FrtekLtd's earnings that will influence how the balance sheet holds up in the future. So if you're keen to discover more about its earnings, it might be worth checking out this graph of its long term earnings trend.
Over 12 months, FrtekLtd reported revenue of ₩22b, which is a gain of 38%, although it did not report any earnings before interest and tax. With any luck the company will be able to grow its way to profitability.
So How Risky Is FrtekLtd?
Although FrtekLtd had an earnings before interest and tax (EBIT) loss over the last twelve months, it made a statutory profit of ₩4.4b. So when you consider it has net cash, along with the statutory profit, the stock probably isn't as risky as it might seem, at least in the short term. Keeping in mind its 38% revenue growth over the last year, we think there's a decent chance the company is on track. We'd see further strong growth as an optimistic indication. There's no doubt that we learn most about debt from the balance sheet. But ultimately, every company can contain risks that exist outside of the balance sheet. For example, we've discovered 2 warning signs for FrtekLtd that you should be aware of before investing here.
If you're interested in investing in businesses that can grow profits without the burden of debt, then check out this free list of growing businesses that have net cash on the balance sheet.
New: AI Stock Screener & Alerts
Our new AI Stock Screener scans the market every day to uncover opportunities.
• Dividend Powerhouses (3%+ Yield)
• Undervalued Small Caps with Insider Buying
• High growth Tech and AI Companies
Or build your own from over 50 metrics.
Have feedback on this article? Concerned about the content? Get in touch with us directly. Alternatively, email editorial-team (at) simplywallst.com.
This article by Simply Wall St is general in nature. We provide commentary based on historical data and analyst forecasts only using an unbiased methodology and our articles are not intended to be financial advice. It does not constitute a recommendation to buy or sell any stock, and does not take account of your objectives, or your financial situation. We aim to bring you long-term focused analysis driven by fundamental data. Note that our analysis may not factor in the latest price-sensitive company announcements or qualitative material. Simply Wall St has no position in any stocks mentioned.
About KOSDAQ:A073540
FrtekLtd
Provides mobile communication systems, LED lighting products, and information communication construction products in South Korea.
Solid track record with excellent balance sheet.
Market Insights

Advertisement
Community Narratives
MicroVision will explode future revenue by 380.37% with a vision towards success
Fair Value US$60.00|98.4% undervalued
TH
Community Contributor
The Indispensable Artery for a New North American Economy
Fair Value CA$132.87|1.3% undervalued
TI
Community Contributor