
Advertisement
- South Korea
- /
- Electronic Equipment and Components
- /
- KOSDAQ:A069330
Is U.I.DisplayLtd (KOSDAQ:069330) Using Too Much Debt?
Warren Buffett famously said, 'Volatility is far from synonymous with risk.' When we think about how risky a company is, we always like to look at its use of debt, since debt overload can lead to ruin. We can see that U.I.Display Co.,Ltd. (KOSDAQ:069330) does use debt in its business. But is this debt a concern to shareholders?
Why Does Debt Bring Risk?
Generally speaking, debt only becomes a real problem when a company can't easily pay it off, either by raising capital or with its own cash flow. Ultimately, if the company can't fulfill its legal obligations to repay debt, shareholders could walk away with nothing. While that is not too common, we often do see indebted companies permanently diluting shareholders because lenders force them to raise capital at a distressed price. Of course, the upside of debt is that it often represents cheap capital, especially when it replaces dilution in a company with the ability to reinvest at high rates of return. When we think about a company's use of debt, we first look at cash and debt together.
How Much Debt Does U.I.DisplayLtd Carry?
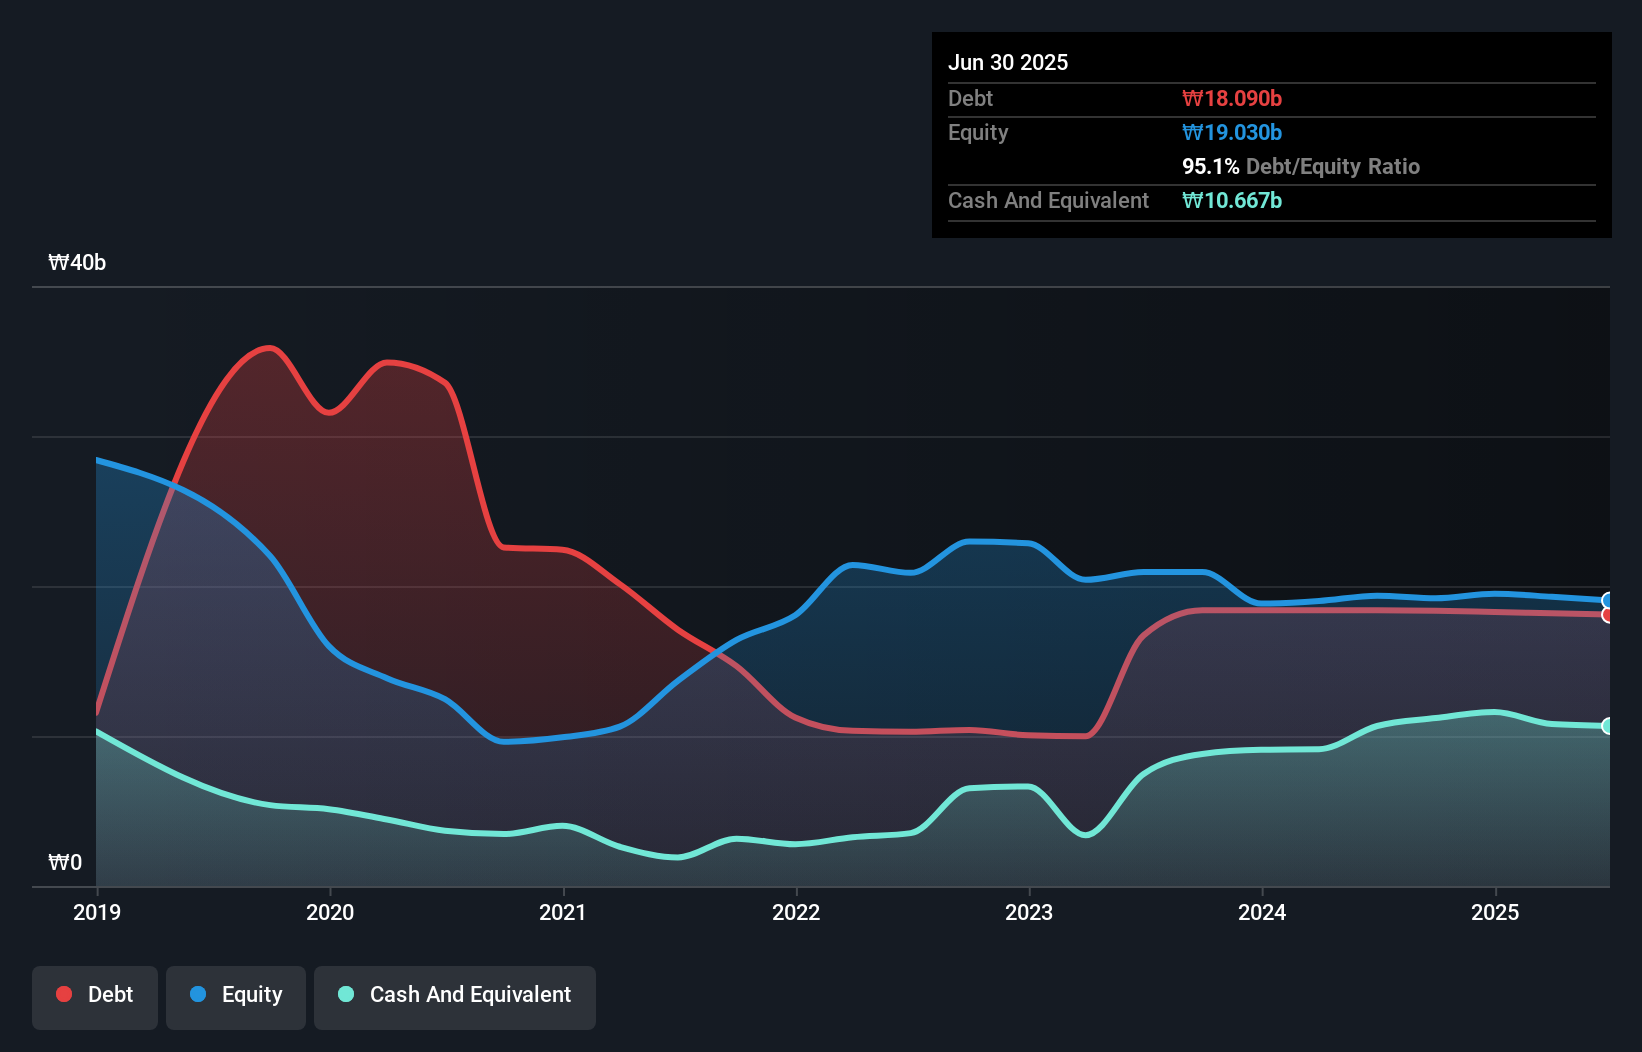
The chart below, which you can click on for greater detail, shows that U.I.DisplayLtd had ₩18.1b in debt in June 2025; about the same as the year before. However, because it has a cash reserve of ₩10.7b, its net debt is less, at about ₩7.42b.
How Healthy Is U.I.DisplayLtd's Balance Sheet?
The latest balance sheet data shows that U.I.DisplayLtd had liabilities of ₩23.0b due within a year, and liabilities of ₩1.54b falling due after that. Offsetting these obligations, it had cash of ₩10.7b as well as receivables valued at ₩5.70b due within 12 months. So its liabilities total ₩8.16b more than the combination of its cash and short-term receivables.
This deficit isn't so bad because U.I.DisplayLtd is worth ₩16.3b, and thus could probably raise enough capital to shore up its balance sheet, if the need arose. But we definitely want to keep our eyes open to indications that its debt is bringing too much risk. The balance sheet is clearly the area to focus on when you are analysing debt. But you can't view debt in total isolation; since U.I.DisplayLtd will need earnings to service that debt. So if you're keen to discover more about its earnings, it might be worth checking out this graph of its long term earnings trend.
Check out our latest analysis for U.I.DisplayLtd
In the last year U.I.DisplayLtd had a loss before interest and tax, and actually shrunk its revenue by 13%, to ₩50b. We would much prefer see growth.
Caveat Emptor
While U.I.DisplayLtd's falling revenue is about as heartwarming as a wet blanket, arguably its earnings before interest and tax (EBIT) loss is even less appealing. Indeed, it lost ₩486m at the EBIT level. When we look at that and recall the liabilities on its balance sheet, relative to cash, it seems unwise to us for the company to have any debt. So we think its balance sheet is a little strained, though not beyond repair. For example, we would not want to see a repeat of last year's loss of ₩173m. So we do think this stock is quite risky. There's no doubt that we learn most about debt from the balance sheet. However, not all investment risk resides within the balance sheet - far from it. For instance, we've identified 1 warning sign for U.I.DisplayLtd that you should be aware of.
When all is said and done, sometimes its easier to focus on companies that don't even need debt. Readers can access a list of growth stocks with zero net debt 100% free, right now.
New: AI Stock Screener & Alerts
Our new AI Stock Screener scans the market every day to uncover opportunities.
• Dividend Powerhouses (3%+ Yield)
• Undervalued Small Caps with Insider Buying
• High growth Tech and AI Companies
Or build your own from over 50 metrics.
Have feedback on this article? Concerned about the content? Get in touch with us directly. Alternatively, email editorial-team (at) simplywallst.com.
This article by Simply Wall St is general in nature. We provide commentary based on historical data and analyst forecasts only using an unbiased methodology and our articles are not intended to be financial advice. It does not constitute a recommendation to buy or sell any stock, and does not take account of your objectives, or your financial situation. We aim to bring you long-term focused analysis driven by fundamental data. Note that our analysis may not factor in the latest price-sensitive company announcements or qualitative material. Simply Wall St has no position in any stocks mentioned.
About KOSDAQ:A069330
U.I.DisplayLtd
Provides ITO coating, outdoor signage, and cover glass lamination products.
Acceptable track record with imperfect balance sheet.
Market Insights

Advertisement
Community Narratives
MicroVision will explode future revenue by 380.37% with a vision towards success
Fair Value US$60.00|98.4% undervalued
TH
Community Contributor
The Indispensable Artery for a New North American Economy
Fair Value CA$132.87|1.3% undervalued
TI
Community Contributor