
Advertisement
- South Korea
- /
- Electronic Equipment and Components
- /
- KOSDAQ:A049520
Is UIL (KOSDAQ:049520) Using Too Much Debt?
David Iben put it well when he said, 'Volatility is not a risk we care about. What we care about is avoiding the permanent loss of capital.' When we think about how risky a company is, we always like to look at its use of debt, since debt overload can lead to ruin. As with many other companies UIL Co., Ltd. (KOSDAQ:049520) makes use of debt. But the more important question is: how much risk is that debt creating?
When Is Debt Dangerous?
Generally speaking, debt only becomes a real problem when a company can't easily pay it off, either by raising capital or with its own cash flow. In the worst case scenario, a company can go bankrupt if it cannot pay its creditors. While that is not too common, we often do see indebted companies permanently diluting shareholders because lenders force them to raise capital at a distressed price. By replacing dilution, though, debt can be an extremely good tool for businesses that need capital to invest in growth at high rates of return. When we examine debt levels, we first consider both cash and debt levels, together.
View our latest analysis for UIL
What Is UIL's Net Debt?
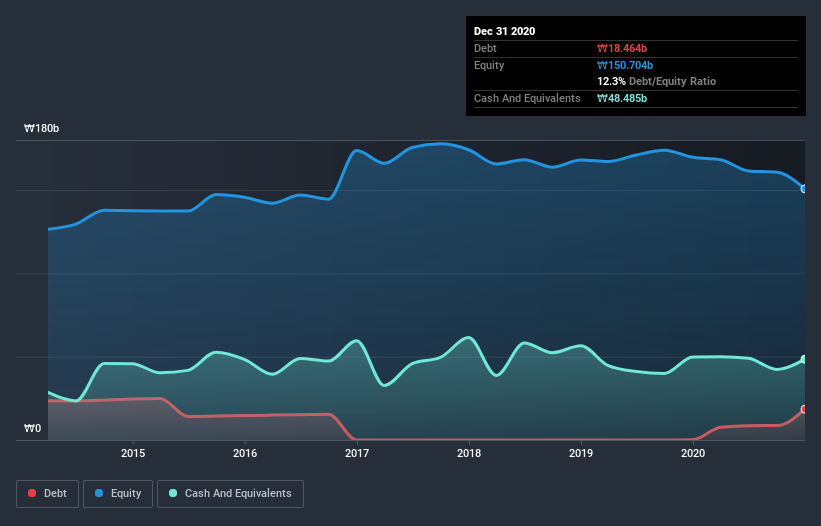
The image below, which you can click on for greater detail, shows that at December 2020 UIL had debt of ₩18.5b, up from ₩204.4m in one year. However, it does have ₩48.5b in cash offsetting this, leading to net cash of ₩30.0b.
How Healthy Is UIL's Balance Sheet?
Zooming in on the latest balance sheet data, we can see that UIL had liabilities of ₩49.2b due within 12 months and liabilities of ₩12.9b due beyond that. On the other hand, it had cash of ₩48.5b and ₩38.2b worth of receivables due within a year. So it actually has ₩24.6b more liquid assets than total liabilities.
This surplus strongly suggests that UIL has a rock-solid balance sheet (and the debt is of no concern whatsoever). On this view, lenders should feel as safe as the beloved of a black-belt karate master. Succinctly put, UIL boasts net cash, so it's fair to say it does not have a heavy debt load! When analysing debt levels, the balance sheet is the obvious place to start. But it is UIL's earnings that will influence how the balance sheet holds up in the future. So when considering debt, it's definitely worth looking at the earnings trend. Click here for an interactive snapshot.
In the last year UIL had a loss before interest and tax, and actually shrunk its revenue by 26%, to ₩301b. That makes us nervous, to say the least.
So How Risky Is UIL?
By their very nature companies that are losing money are more risky than those with a long history of profitability. And in the last year UIL had an earnings before interest and tax (EBIT) loss, truth be told. And over the same period it saw negative free cash outflow of ₩13b and booked a ₩11b accounting loss. Given it only has net cash of ₩30.0b, the company may need to raise more capital if it doesn't reach break-even soon. Even though its balance sheet seems sufficiently liquid, debt always makes us a little nervous if a company doesn't produce free cash flow regularly. When analysing debt levels, the balance sheet is the obvious place to start. However, not all investment risk resides within the balance sheet - far from it. We've identified 3 warning signs with UIL (at least 1 which is potentially serious) , and understanding them should be part of your investment process.
When all is said and done, sometimes its easier to focus on companies that don't even need debt. Readers can access a list of growth stocks with zero net debt 100% free, right now.
When trading UIL or any other investment, use the platform considered by many to be the Professional's Gateway to the Worlds Market, Interactive Brokers. You get the lowest-cost* trading on stocks, options, futures, forex, bonds and funds worldwide from a single integrated account. Promoted
New: AI Stock Screener & Alerts
Our new AI Stock Screener scans the market every day to uncover opportunities.
• Dividend Powerhouses (3%+ Yield)
• Undervalued Small Caps with Insider Buying
• High growth Tech and AI Companies
Or build your own from over 50 metrics.
This article by Simply Wall St is general in nature. It does not constitute a recommendation to buy or sell any stock, and does not take account of your objectives, or your financial situation. We aim to bring you long-term focused analysis driven by fundamental data. Note that our analysis may not factor in the latest price-sensitive company announcements or qualitative material. Simply Wall St has no position in any stocks mentioned.
*Interactive Brokers Rated Lowest Cost Broker by StockBrokers.com Annual Online Review 2020
Have feedback on this article? Concerned about the content? Get in touch with us directly. Alternatively, email editorial-team (at) simplywallst.com.
About KOSDAQ:A049520
UIL
Manufactures and sells electronic parts to smartphone manufacturers in South Korea and internationally.
Flawless balance sheet, good value and pays a dividend.
Market Insights

Advertisement
Community Narratives
MicroVision will explode future revenue by 380.37% with a vision towards success
Fair Value US$60.00|98.4% undervalued
TH
Community Contributor
The Indispensable Artery for a New North American Economy
Fair Value CA$132.87|1.3% undervalued
TI
Community Contributor