
Advertisement
- South Korea
- /
- Electronic Equipment and Components
- /
- KOSDAQ:A049520
Further Upside For UIL Co., Ltd. (KOSDAQ:049520) Shares Could Introduce Price Risks After 28% Bounce
UIL Co., Ltd. (KOSDAQ:049520) shares have continued their recent momentum with a 28% gain in the last month alone. Looking back a bit further, it's encouraging to see the stock is up 46% in the last year.
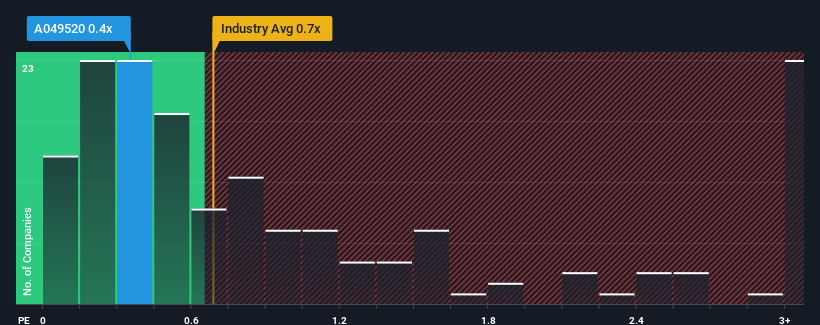
Although its price has surged higher, there still wouldn't be many who think UIL's price-to-sales (or "P/S") ratio of 0.4x is worth a mention when the median P/S in Korea's Electronic industry is similar at about 0.7x. Although, it's not wise to simply ignore the P/S without explanation as investors may be disregarding a distinct opportunity or a costly mistake.
View our latest analysis for UIL
How Has UIL Performed Recently?
With revenue growth that's exceedingly strong of late, UIL has been doing very well. Perhaps the market is expecting future revenue performance to taper off, which has kept the P/S from rising. Those who are bullish on UIL will be hoping that this isn't the case, so that they can pick up the stock at a lower valuation.
Although there are no analyst estimates available for UIL, take a look at this free data-rich visualisation to see how the company stacks up on earnings, revenue and cash flow.What Are Revenue Growth Metrics Telling Us About The P/S?
UIL's P/S ratio would be typical for a company that's only expected to deliver moderate growth, and importantly, perform in line with the industry.
If we review the last year of revenue growth, the company posted a terrific increase of 32%. Pleasingly, revenue has also lifted 60% in aggregate from three years ago, thanks to the last 12 months of growth. Accordingly, shareholders would have definitely welcomed those medium-term rates of revenue growth.
Comparing that recent medium-term revenue trajectory with the industry's one-year growth forecast of 8.5% shows it's noticeably more attractive.
In light of this, it's curious that UIL's P/S sits in line with the majority of other companies. Apparently some shareholders believe the recent performance is at its limits and have been accepting lower selling prices.
The Key Takeaway
UIL appears to be back in favour with a solid price jump bringing its P/S back in line with other companies in the industry It's argued the price-to-sales ratio is an inferior measure of value within certain industries, but it can be a powerful business sentiment indicator.
We've established that UIL currently trades on a lower than expected P/S since its recent three-year growth is higher than the wider industry forecast. When we see strong revenue with faster-than-industry growth, we can only assume potential risks are what might be placing pressure on the P/S ratio. While recent revenue trends over the past medium-term suggest that the risk of a price decline is low, investors appear to see the likelihood of revenue fluctuations in the future.
A lot of potential risks can sit within a company's balance sheet. You can assess many of the main risks through our free balance sheet analysis for UIL with six simple checks.
If you're unsure about the strength of UIL's business, why not explore our interactive list of stocks with solid business fundamentals for some other companies you may have missed.
New: AI Stock Screener & Alerts
Our new AI Stock Screener scans the market every day to uncover opportunities.
• Dividend Powerhouses (3%+ Yield)
• Undervalued Small Caps with Insider Buying
• High growth Tech and AI Companies
Or build your own from over 50 metrics.
Have feedback on this article? Concerned about the content? Get in touch with us directly. Alternatively, email editorial-team (at) simplywallst.com.
This article by Simply Wall St is general in nature. We provide commentary based on historical data and analyst forecasts only using an unbiased methodology and our articles are not intended to be financial advice. It does not constitute a recommendation to buy or sell any stock, and does not take account of your objectives, or your financial situation. We aim to bring you long-term focused analysis driven by fundamental data. Note that our analysis may not factor in the latest price-sensitive company announcements or qualitative material. Simply Wall St has no position in any stocks mentioned.
About KOSDAQ:A049520
UIL
Manufactures and sells electronic parts to smartphone manufacturers in South Korea and internationally.
Flawless balance sheet, good value and pays a dividend.
Market Insights

Advertisement
Community Narratives
MicroVision will explode future revenue by 380.37% with a vision towards success
Fair Value US$60.00|98.4% undervalued
TH
Community Contributor
The Indispensable Artery for a New North American Economy
Fair Value CA$132.87|1.3% undervalued
TI
Community Contributor